Following last action’s plan, I decided to look at the data of objects around me. Thanks to Zach’s suggestions about looking at data outside of the realm of digital and numerical, I started to look at objects and made my own criteria for collecting data.

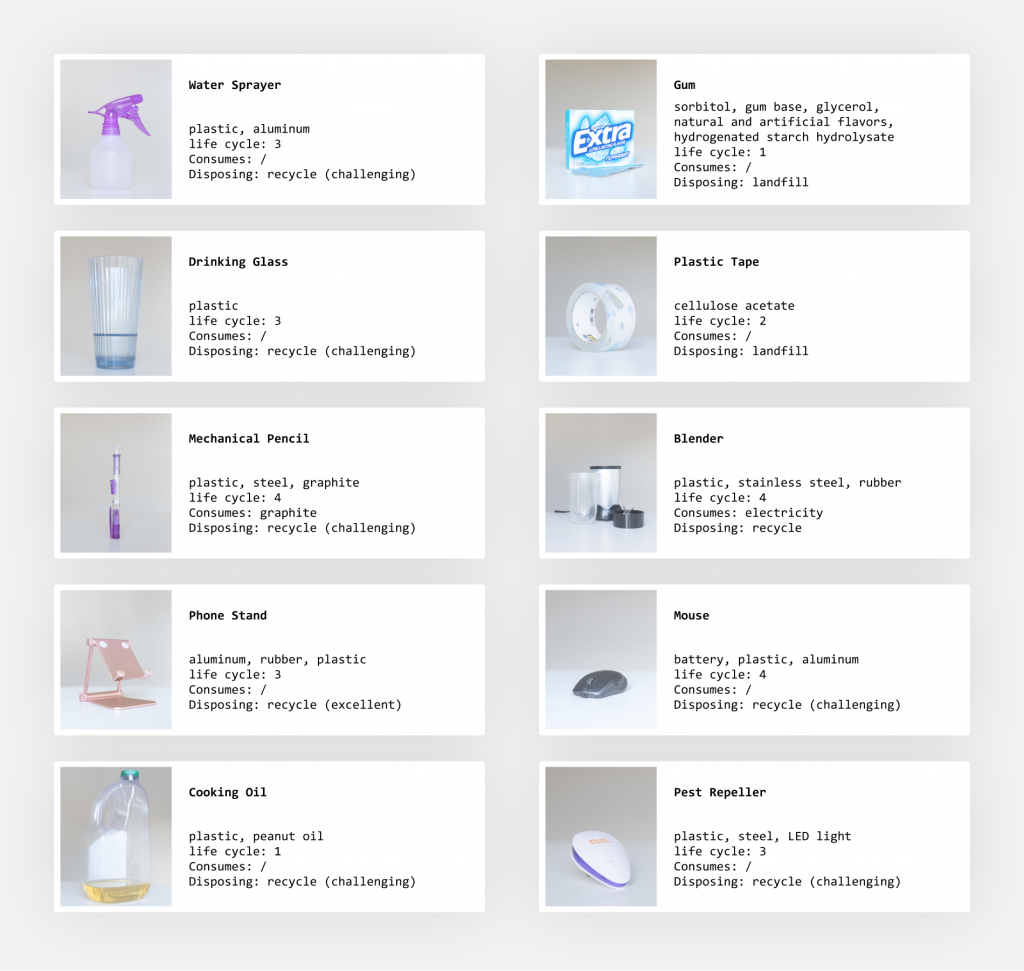
Gathered around 10 small objects, I looked for what they had in common. Turned out, material was a crucial part. Other than that, I decided to evaluate their “life cycles”, that is how quickly these objects will eventually be threw away or lose their intended functions. By creating a grading system that considers its structural complexity, usage frequency / length, and possibility of getting repaired, I assessed the life cycle for each item, ranging from 1 to 5. The results are very informative.

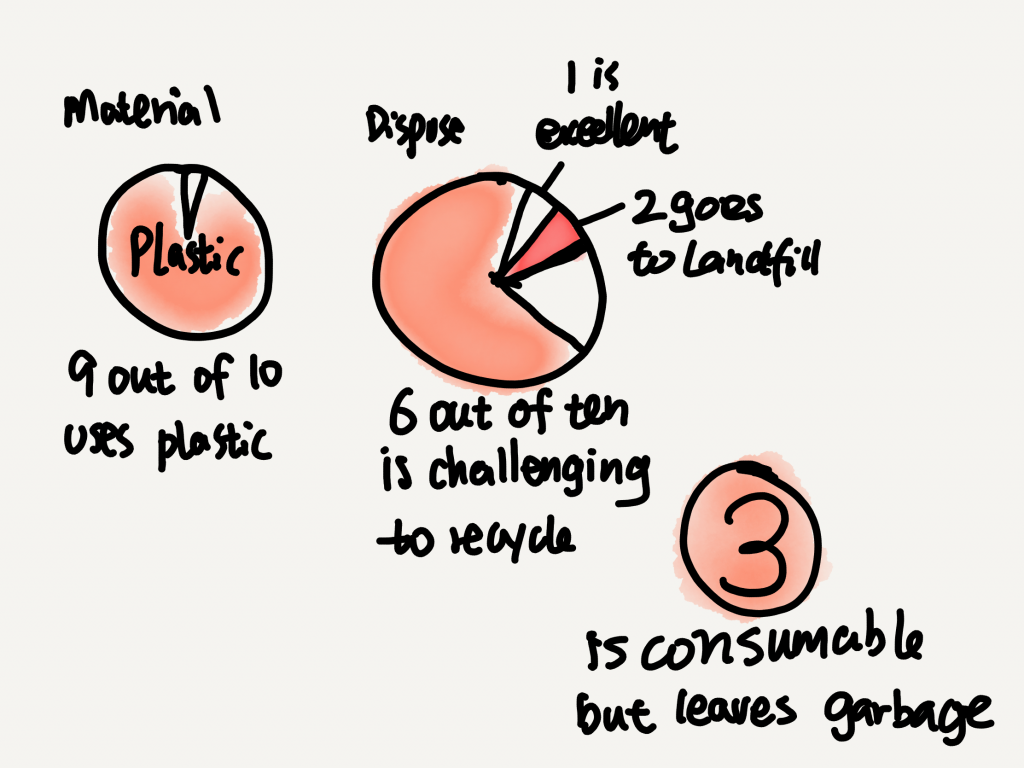
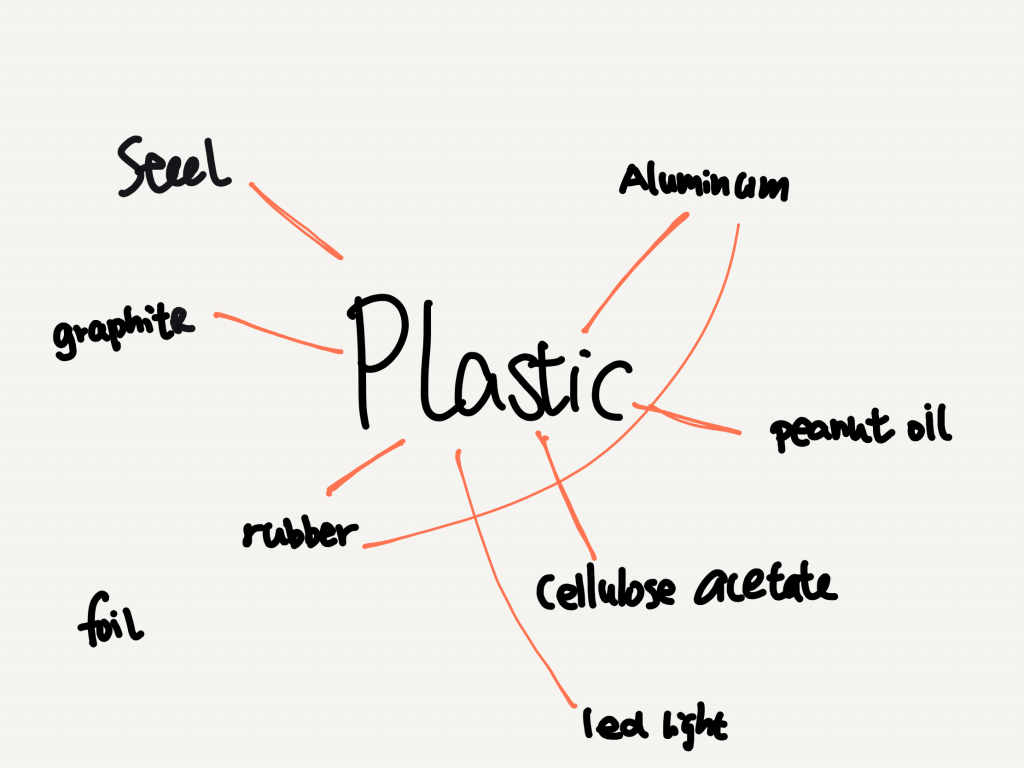
I then made sketches on how these data could be analyzed and visualized. The first diagram shows out of these ten objects, how many contains plastic, and how can they be disposed. It informs me that these frequently used objects are not the best choice for the environment. But at the time of purchase, considering its other properties, like functionality, price, and convenience, it might had been the best option for my need. The fact that my analysis of their “environmental data” makes me question my first choice is quite inspiring: At the time of purchase, somehow I tucked the consideration for the environment, as well as the work of analyzing their impact to the back of my head, and prioritized my need for their functions at the moment. In retrospective, after investing some time into knowing its impact, I realized that there were better options than buying those products, and it is something I would consider next time before making decisions. If this assessment process happens before every decision, the objects around me will be much friendlier to the environment.

