I would like to thank Chiara Schmitt, Marcia Higuci, Meghna Mitra, and April Tian for their participation in this studio project. It would not have been possible without their incredible contributuion.
For this project, I wanted to explore choice and probability a little further while still considering the questions that have been driving my practice.
How can the concept of the Metafunction inform the narrative (less) within design?
How do the embedded narratives found within object oriented design predetermined values and qualities for narrative (less) objects?
In order to do this I needed to formulate some goals.
- Create a form that allows participants to choose characteristics
- Design a workshop that allows participants to use those choices and transform them into probabilities
- Collect all choices and probabilities into a data set
- Model the data into a parametric definition
- Convert the renderings into 2D images using a Risograph
- Make it FUN?
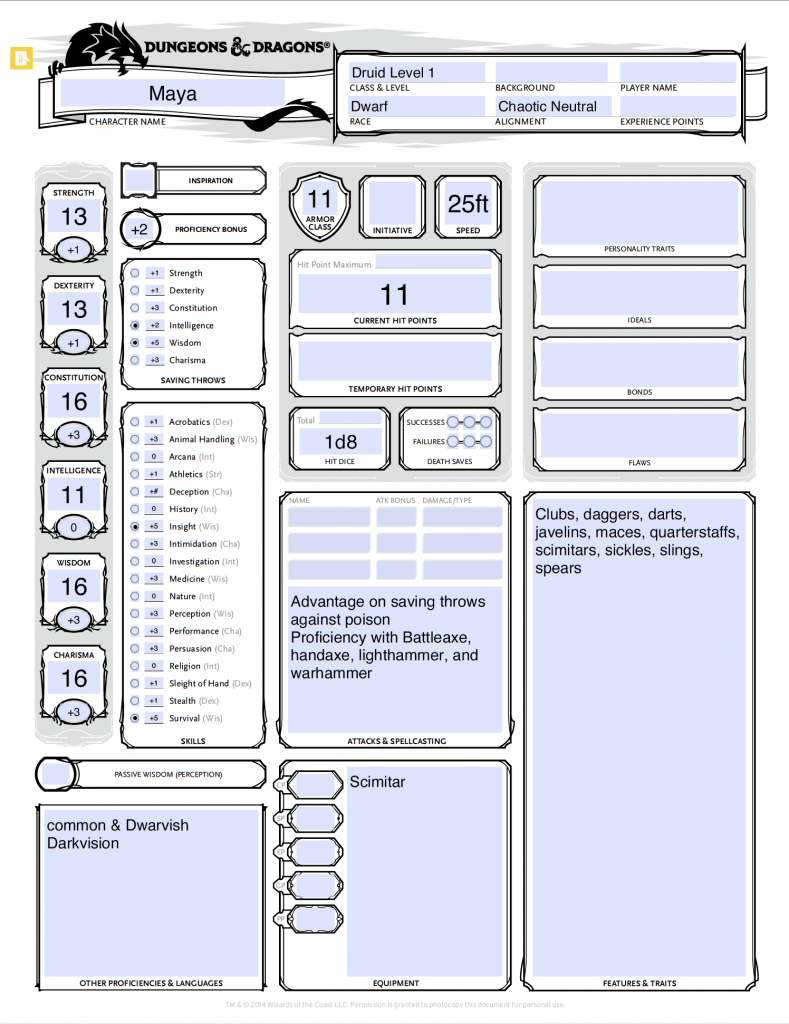
I decided to use game design to form the parameters of this project. More specifically, I decided to use the rules and formats of the role playing game Dungeons & Dragons (5th edition), with regards to character creation.
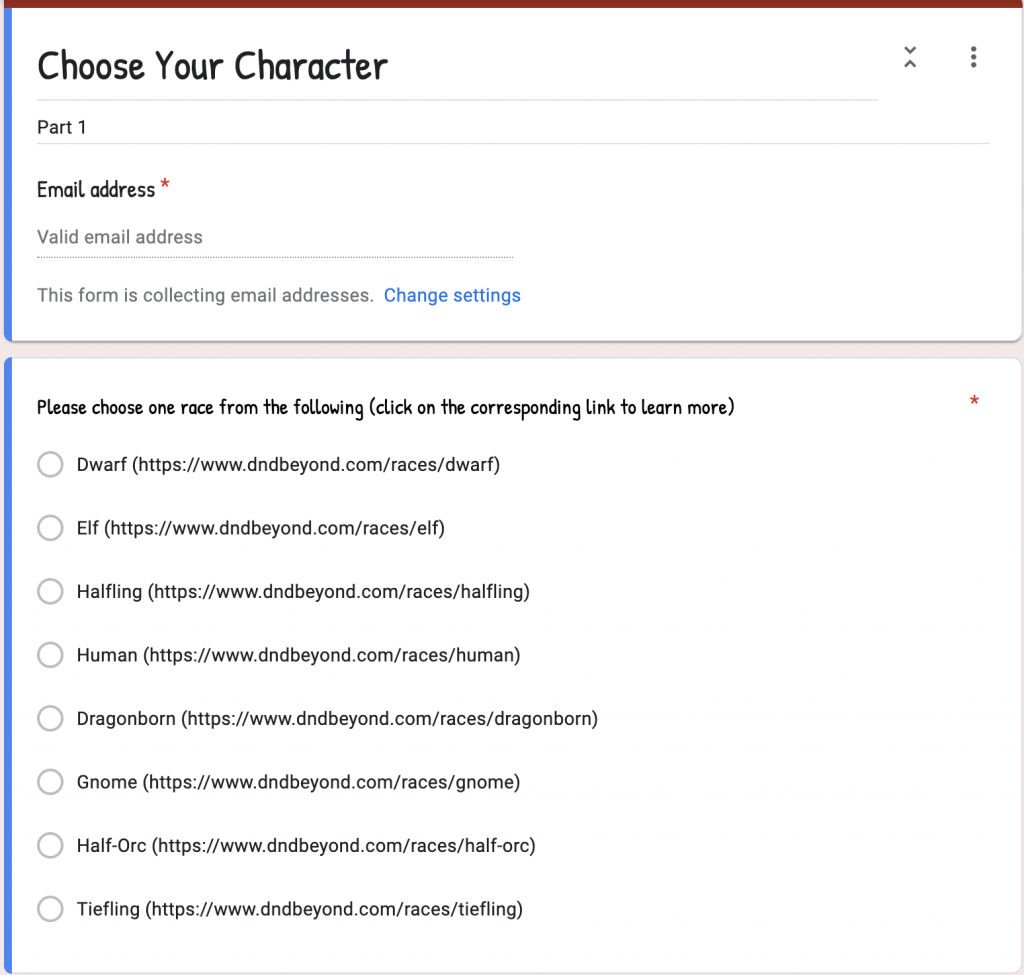
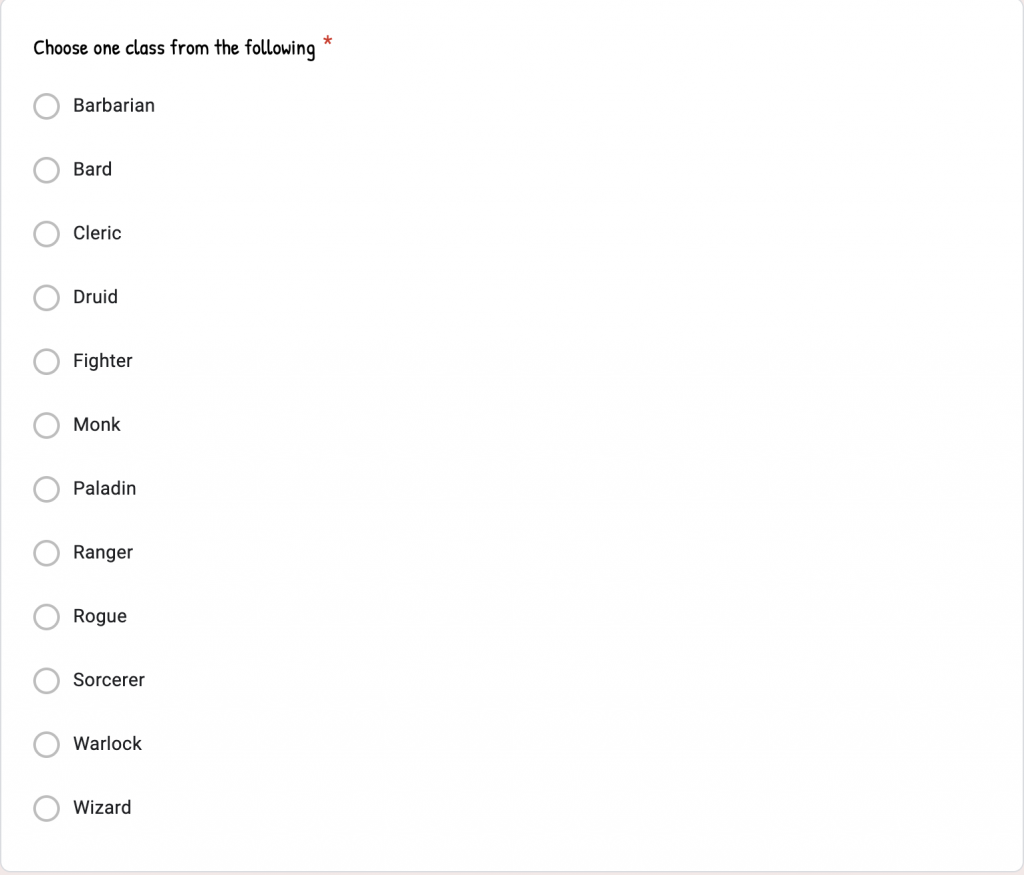
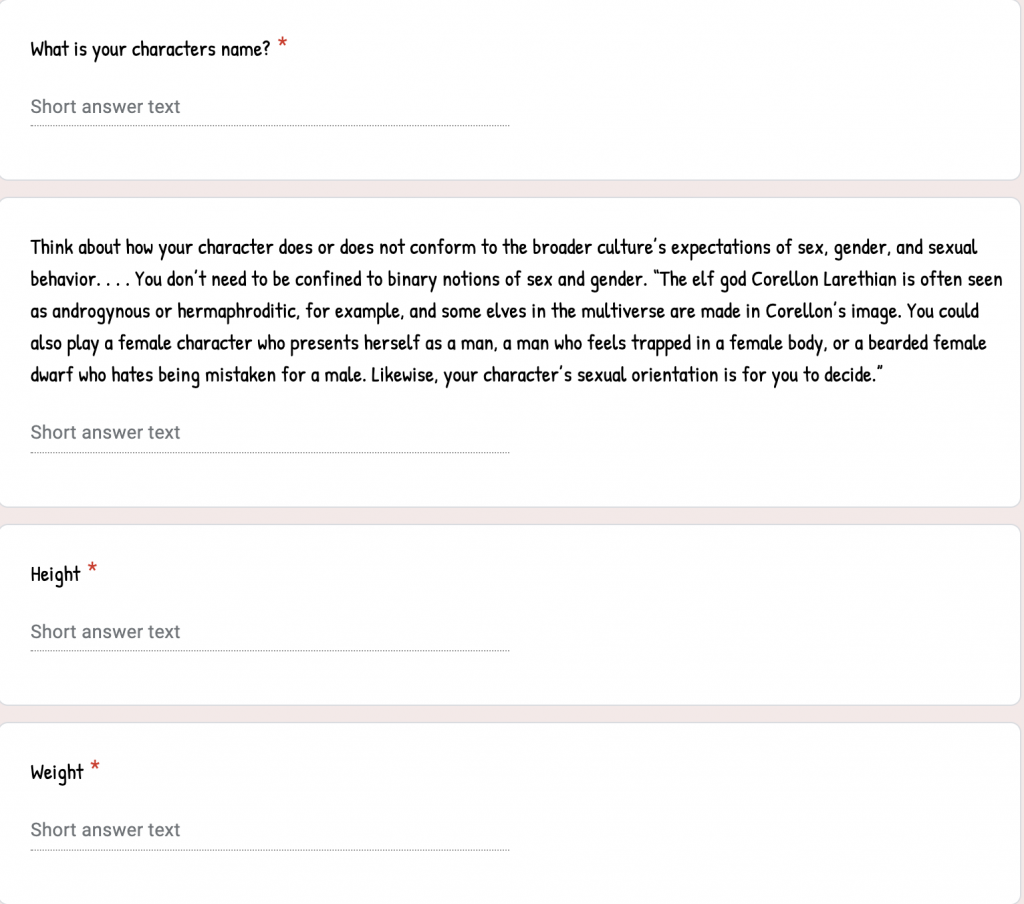
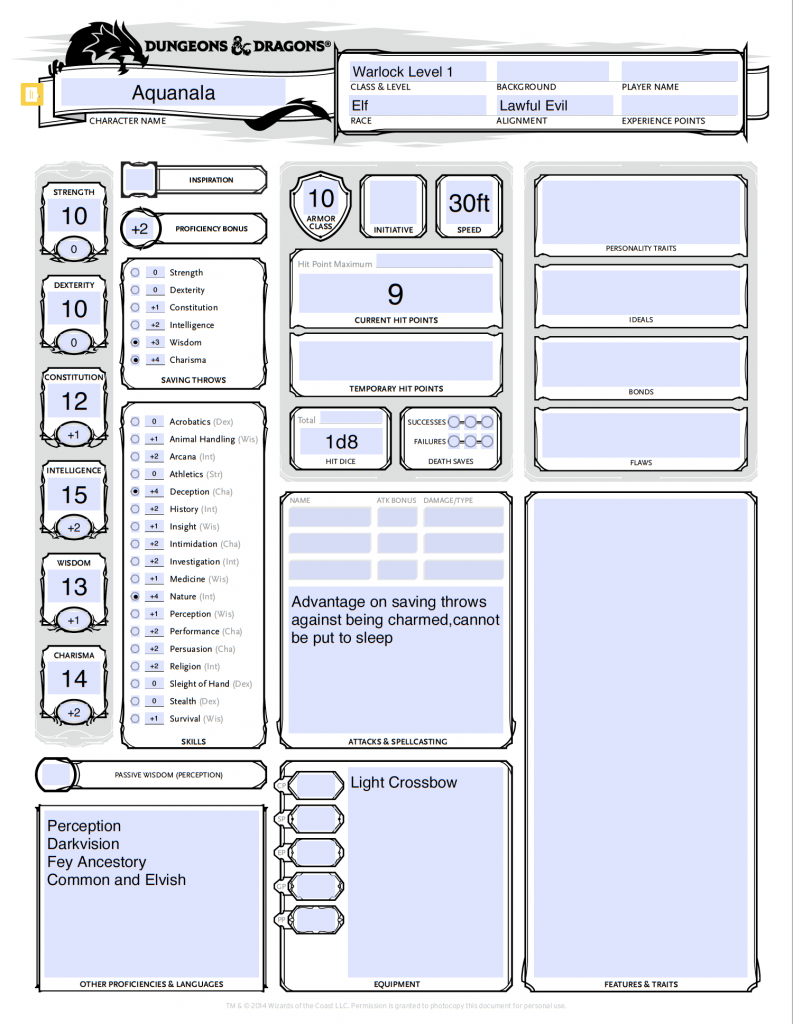
I created a survey/form that allowed participants to create character traits such as name, identity, race, class.
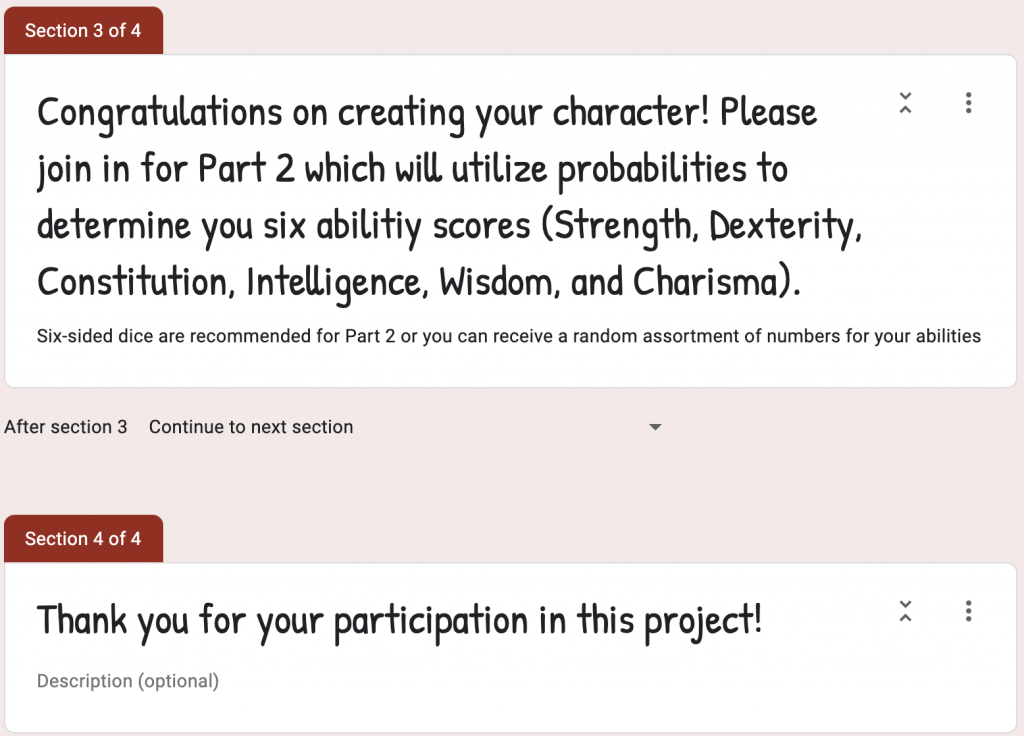
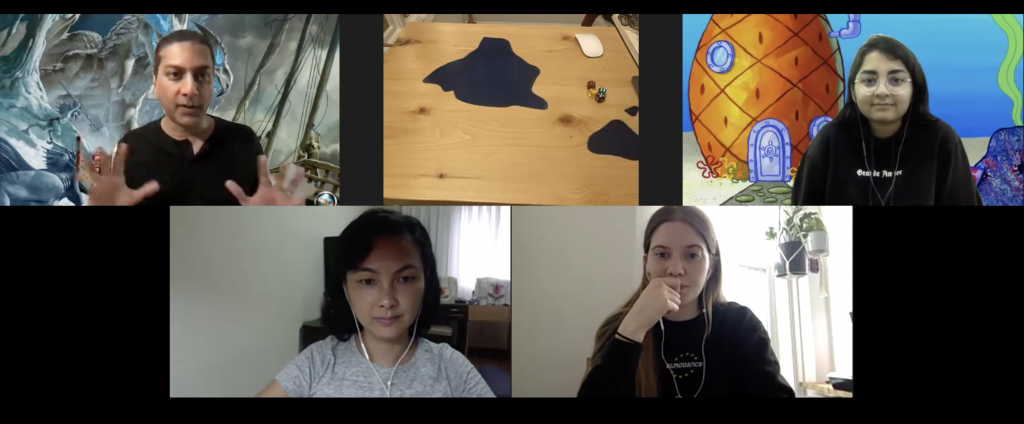
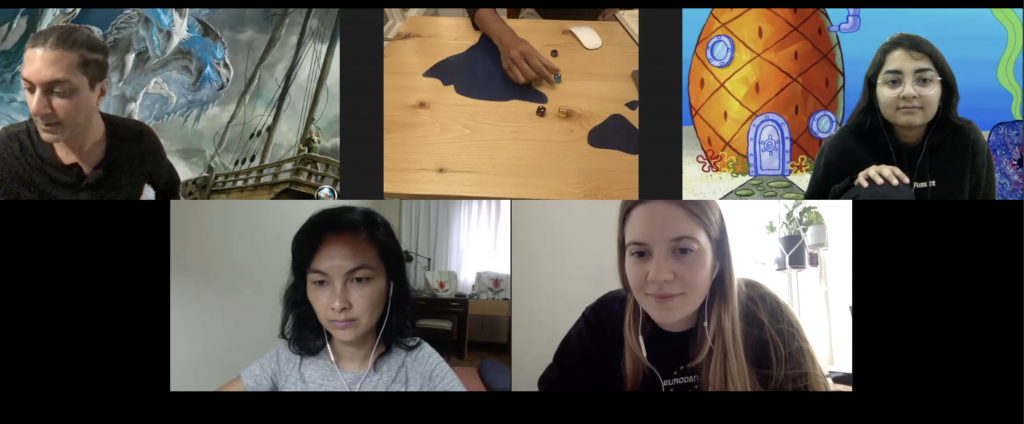
I then created a workshop where participants could role 4 six-sided die to determine 6 abilities. Each participant could use their own set of dice, accept a random assignment of 6 scores, or have the moderator role for them in real time. For each role, the lowest number was removed leaving 3 die to be added up.
The combination of survey/form answers and workshop probability scores were used to create a full character with all attributes.
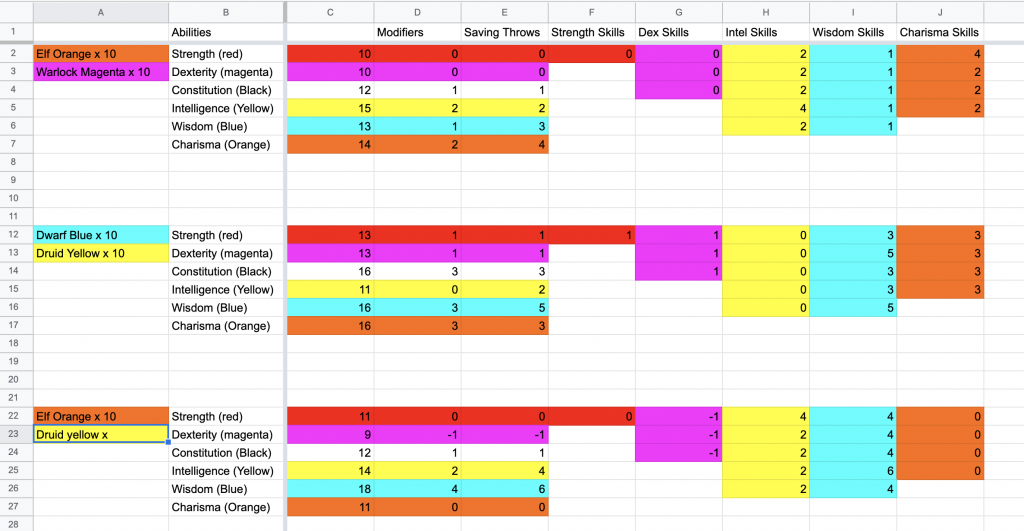
I then collated all of the data into a spreadsheet.
The next phase was to create a parametric definition for the data within grasshopper. The first tests were failures.
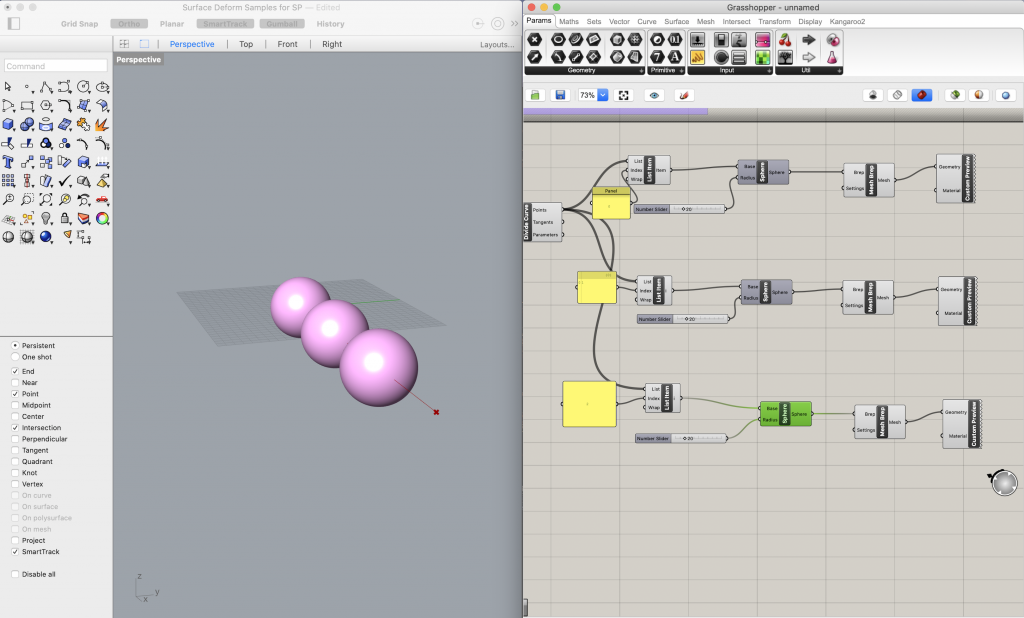
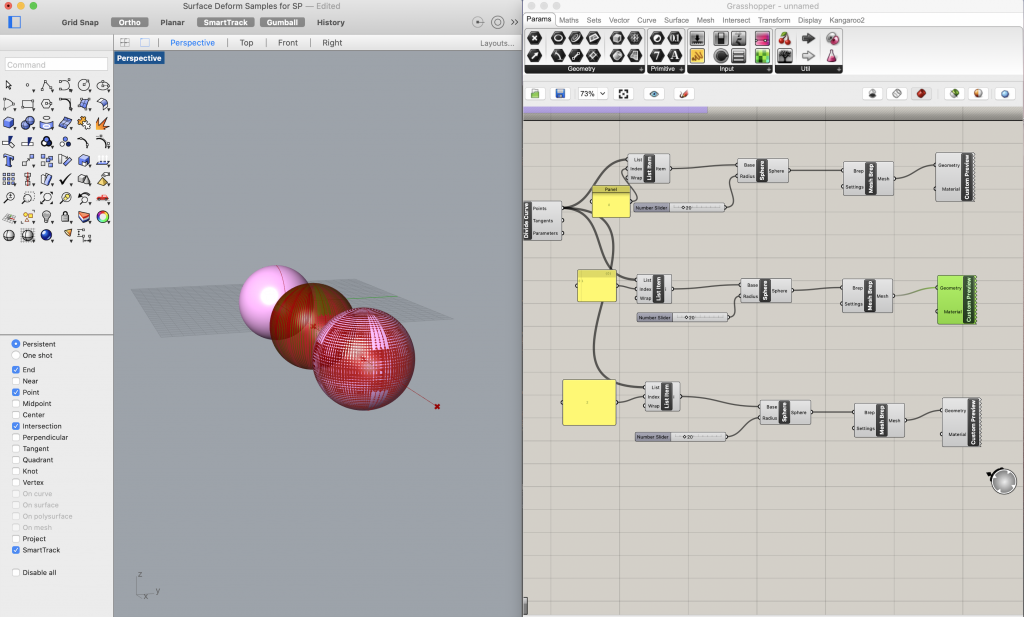
But eventually, I was able to design a definition that really worked.
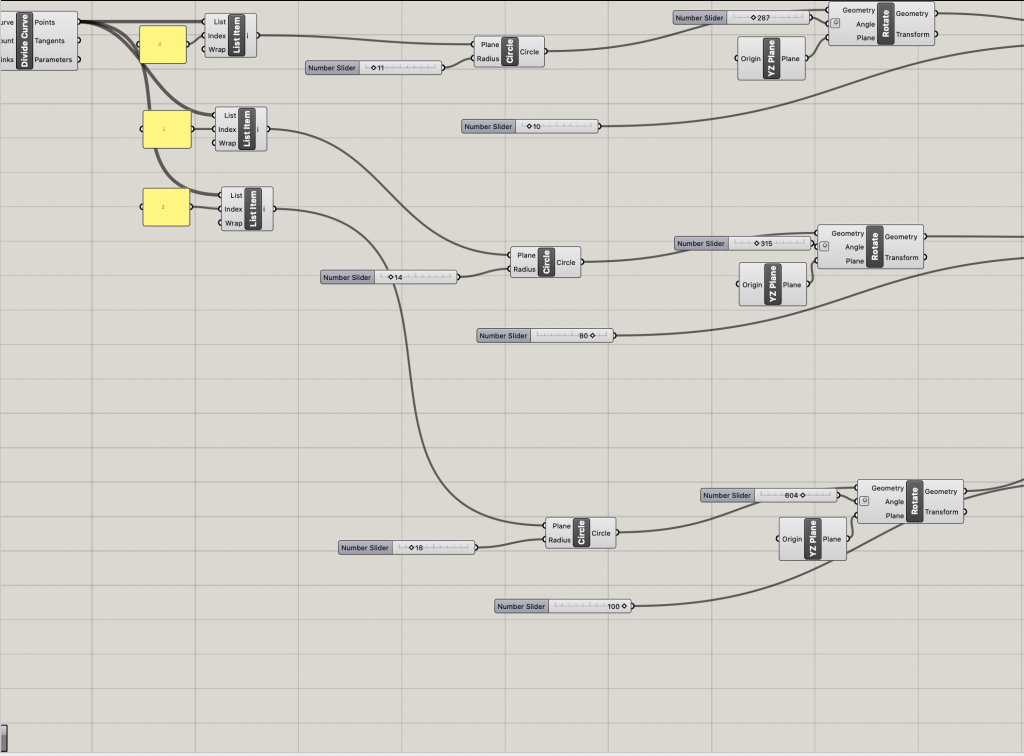
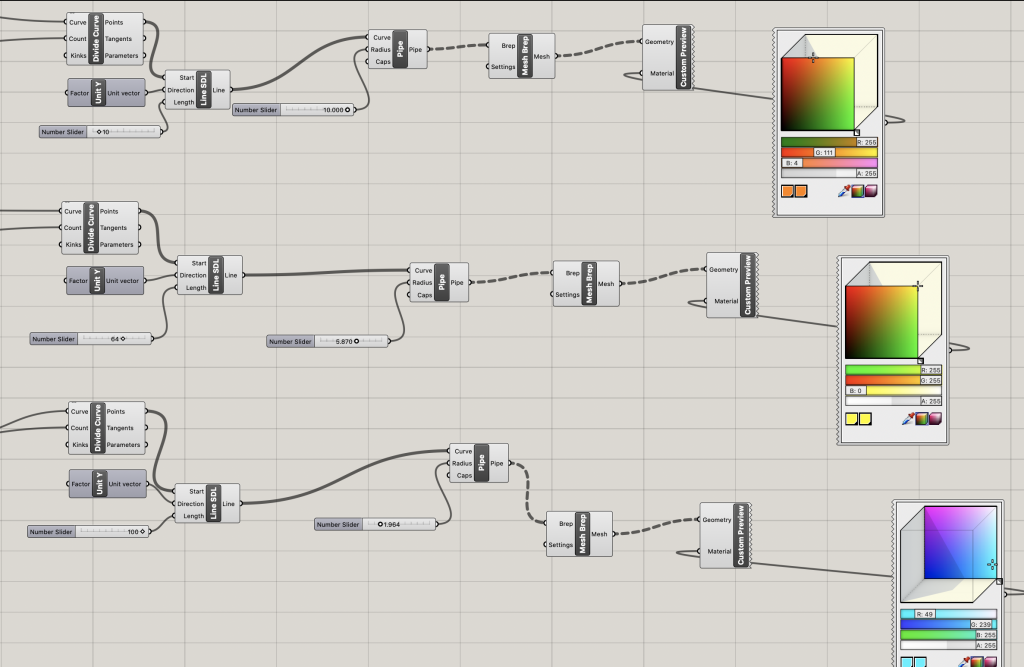
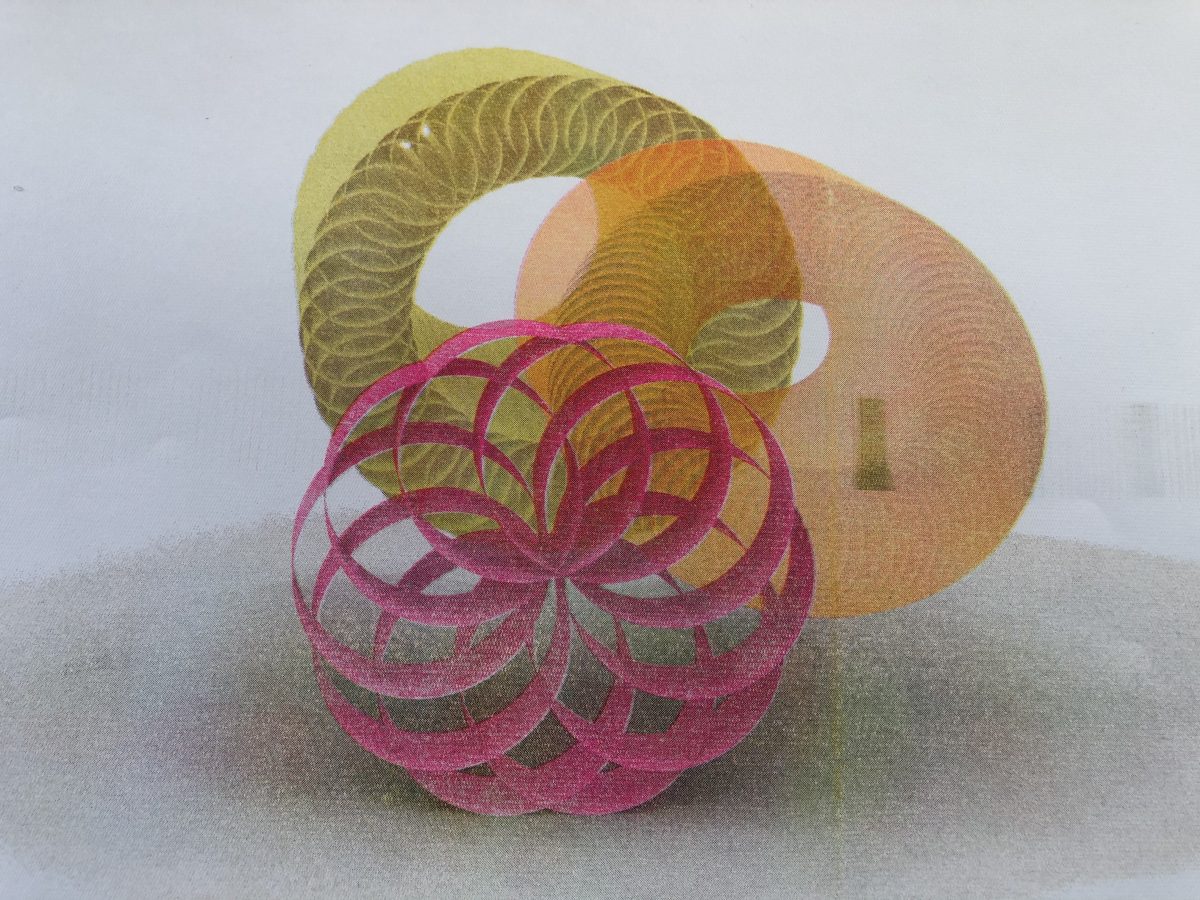
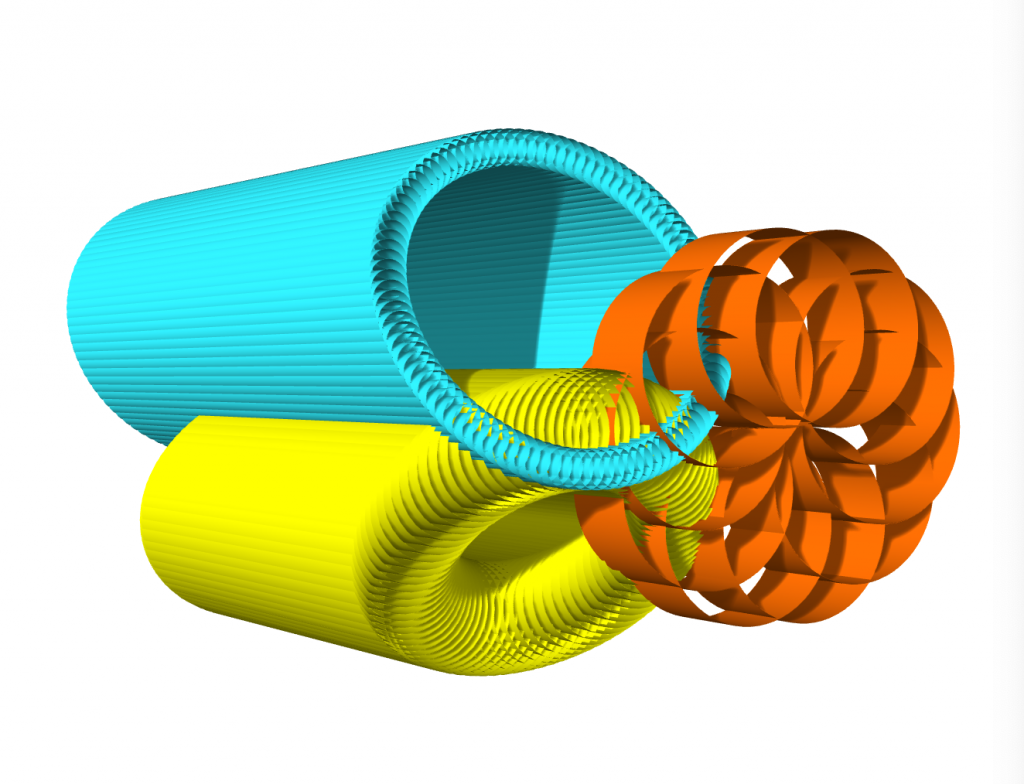
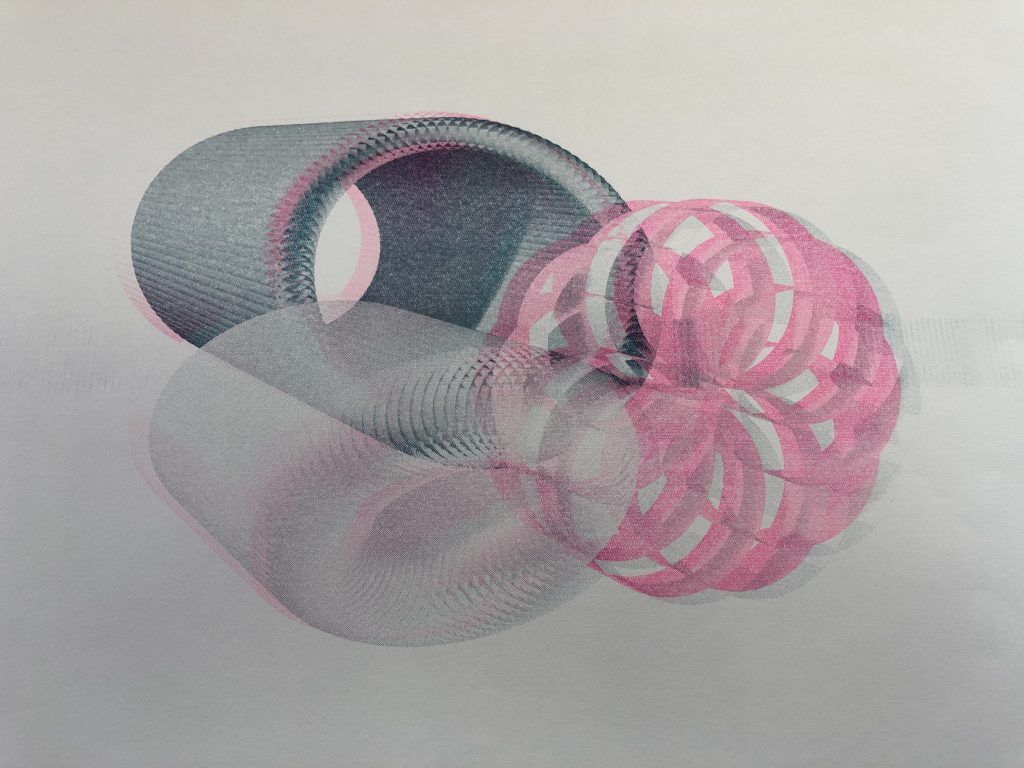
Using this parametric definition, I was able to generate the following renderings for all 3 participants.
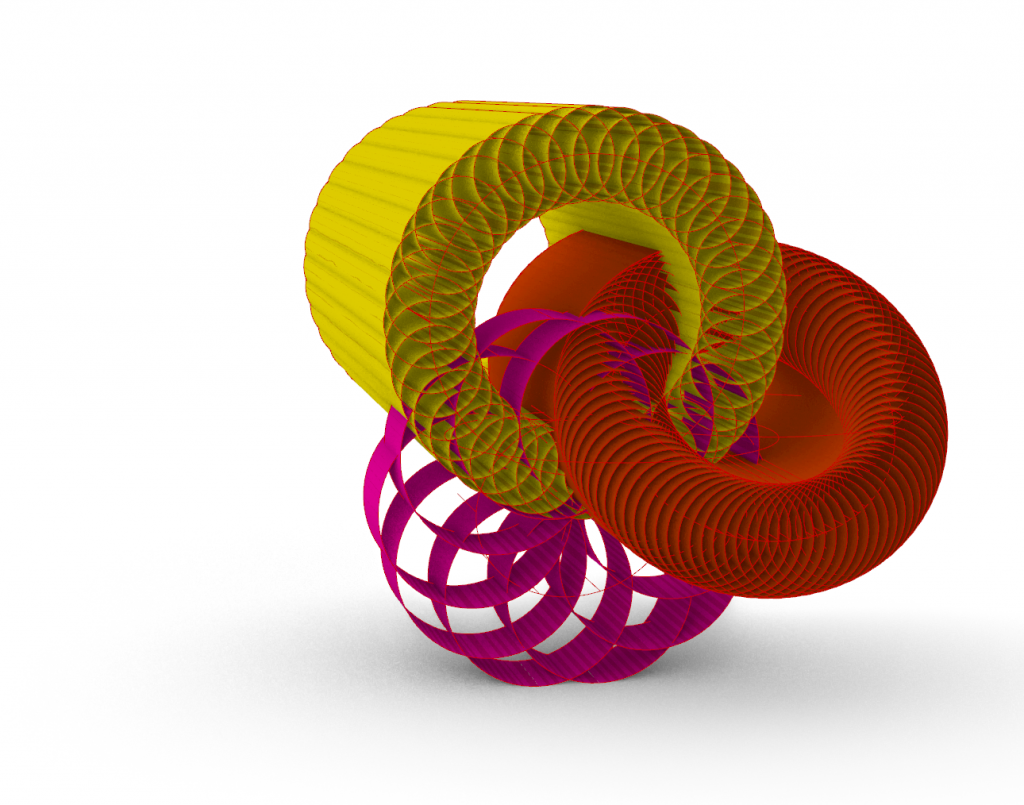
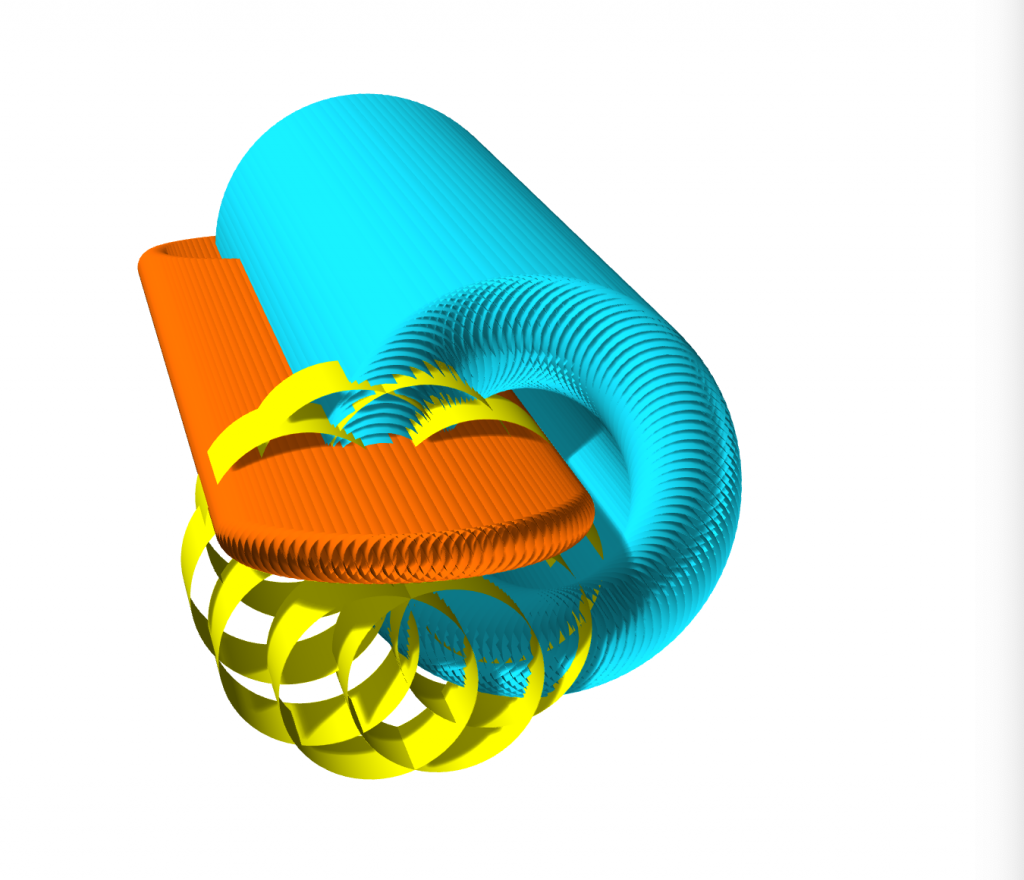
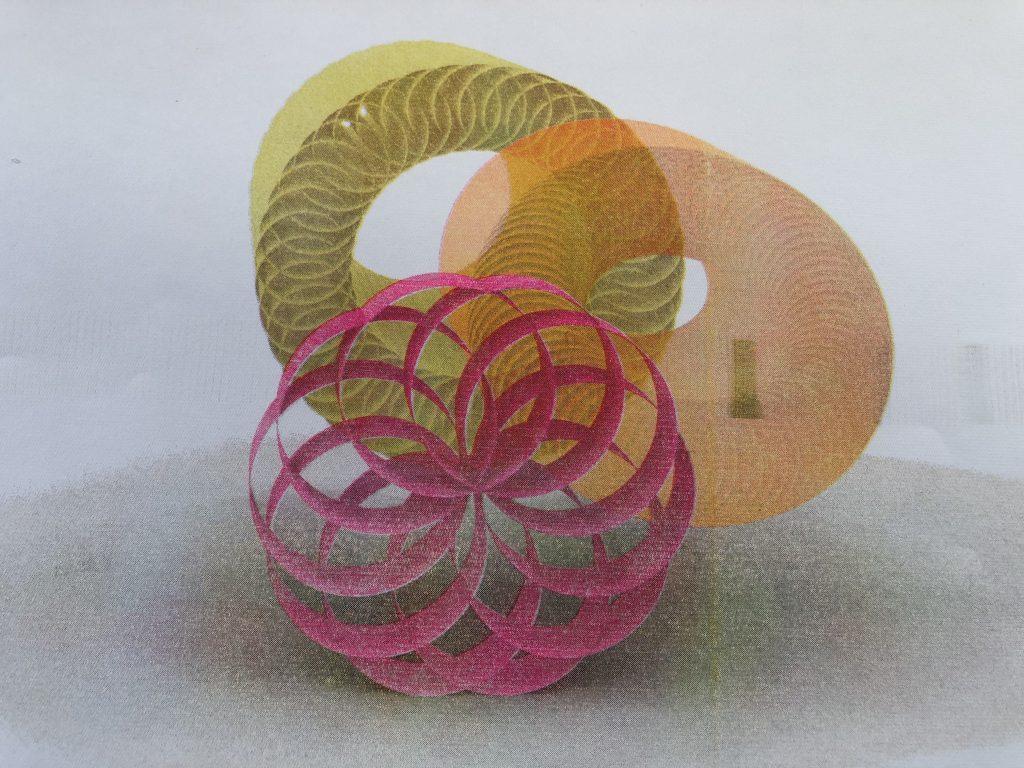
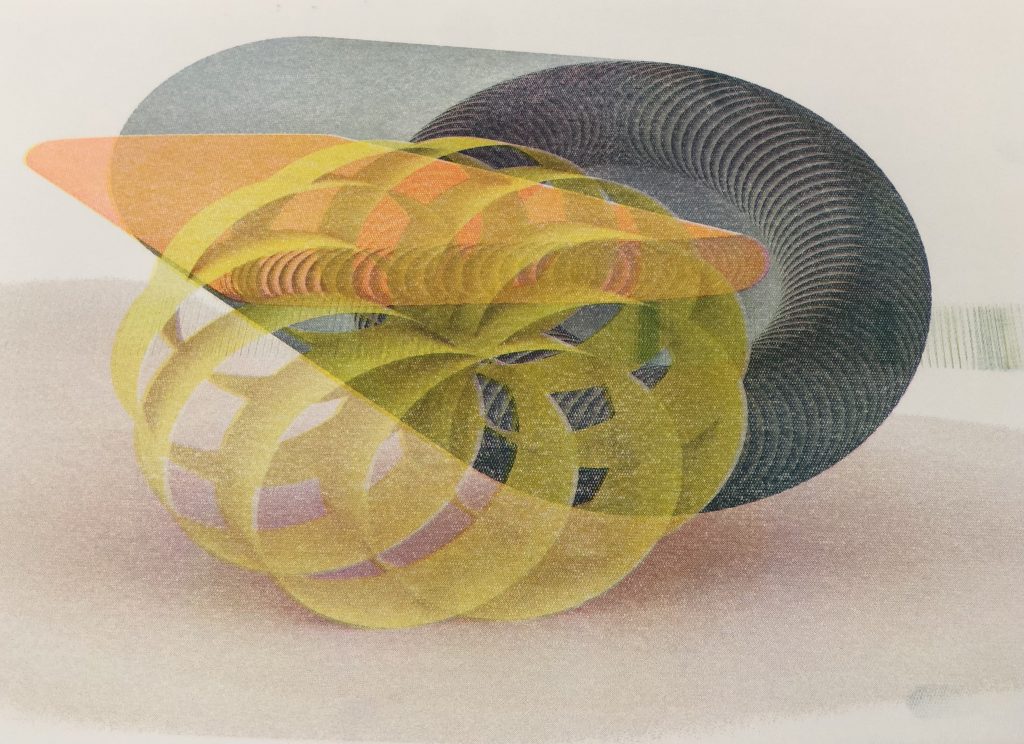
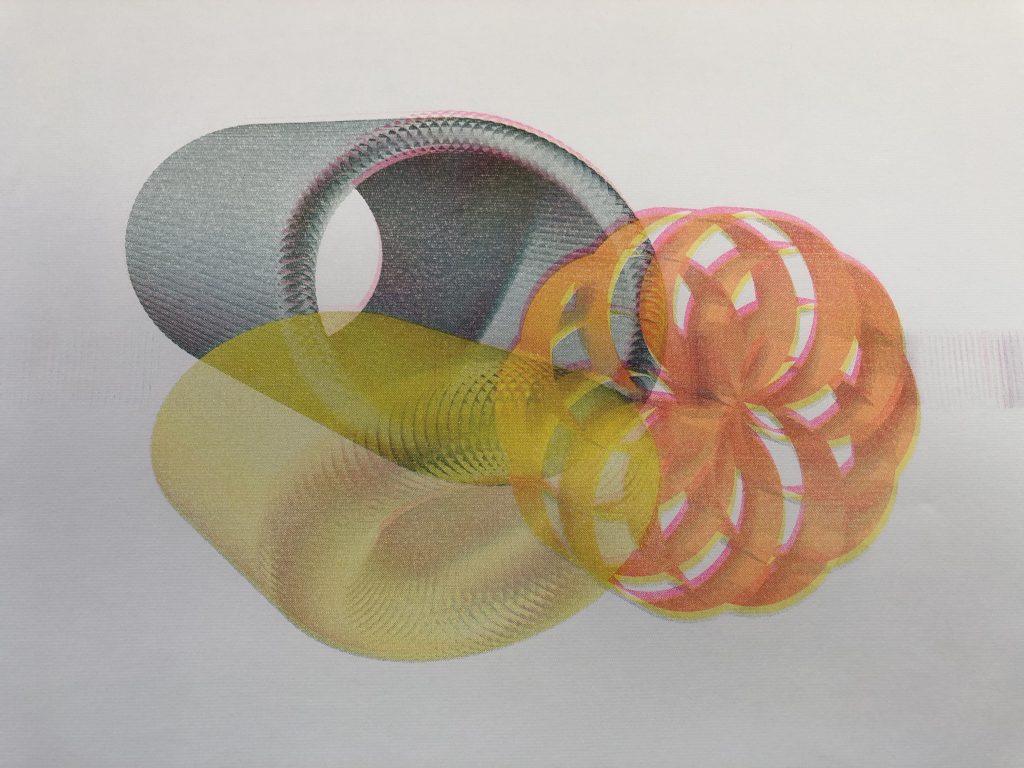
At this point, I was very satisfied with the project and how it was turning out. However, the next step was to convert the rendered files into a format that could be printed on a Risograph. This was extremely challenging and took a great deal of software wizardry and perhaps a certain measure of good fortune. This resulted in 3 unique prints with a few 2 color variants.
After reflection there are many questions and improvements I would like to implement upon further iterations.
Follow up with participants on survey and workshop format
-What worked? What didn’t? What would you change? Did anything stand out?
Parametric Definitions?
-Design something more universal that can handle any amount of data
-Exists independently
Risograph
-Avoid rendering and TIFF conversions and spend more time learning PDF files
Overall, I’m very happy with the various components of the project from the initial questions, to the methods and methodologies, the implementation, and the results. However, I feel like the project left me a little bit drained and perhaps lacking in a criticality that is relevant to society.
One reply on “Choice & Probability”
This is great, really cool! The prints are great. I’m super curious about what my render and print would look like. Count me in for v.2!