This Project started with a question about nature accessibility. Coming from an urban city with limited green space, I saw myself immersed in nature after moving to Vancouver. This made me happy and thankful at first but also slightly uncomfortable, thinking about my past living conditions and how many people throughout the world also may suffer from “nature deficiency”.
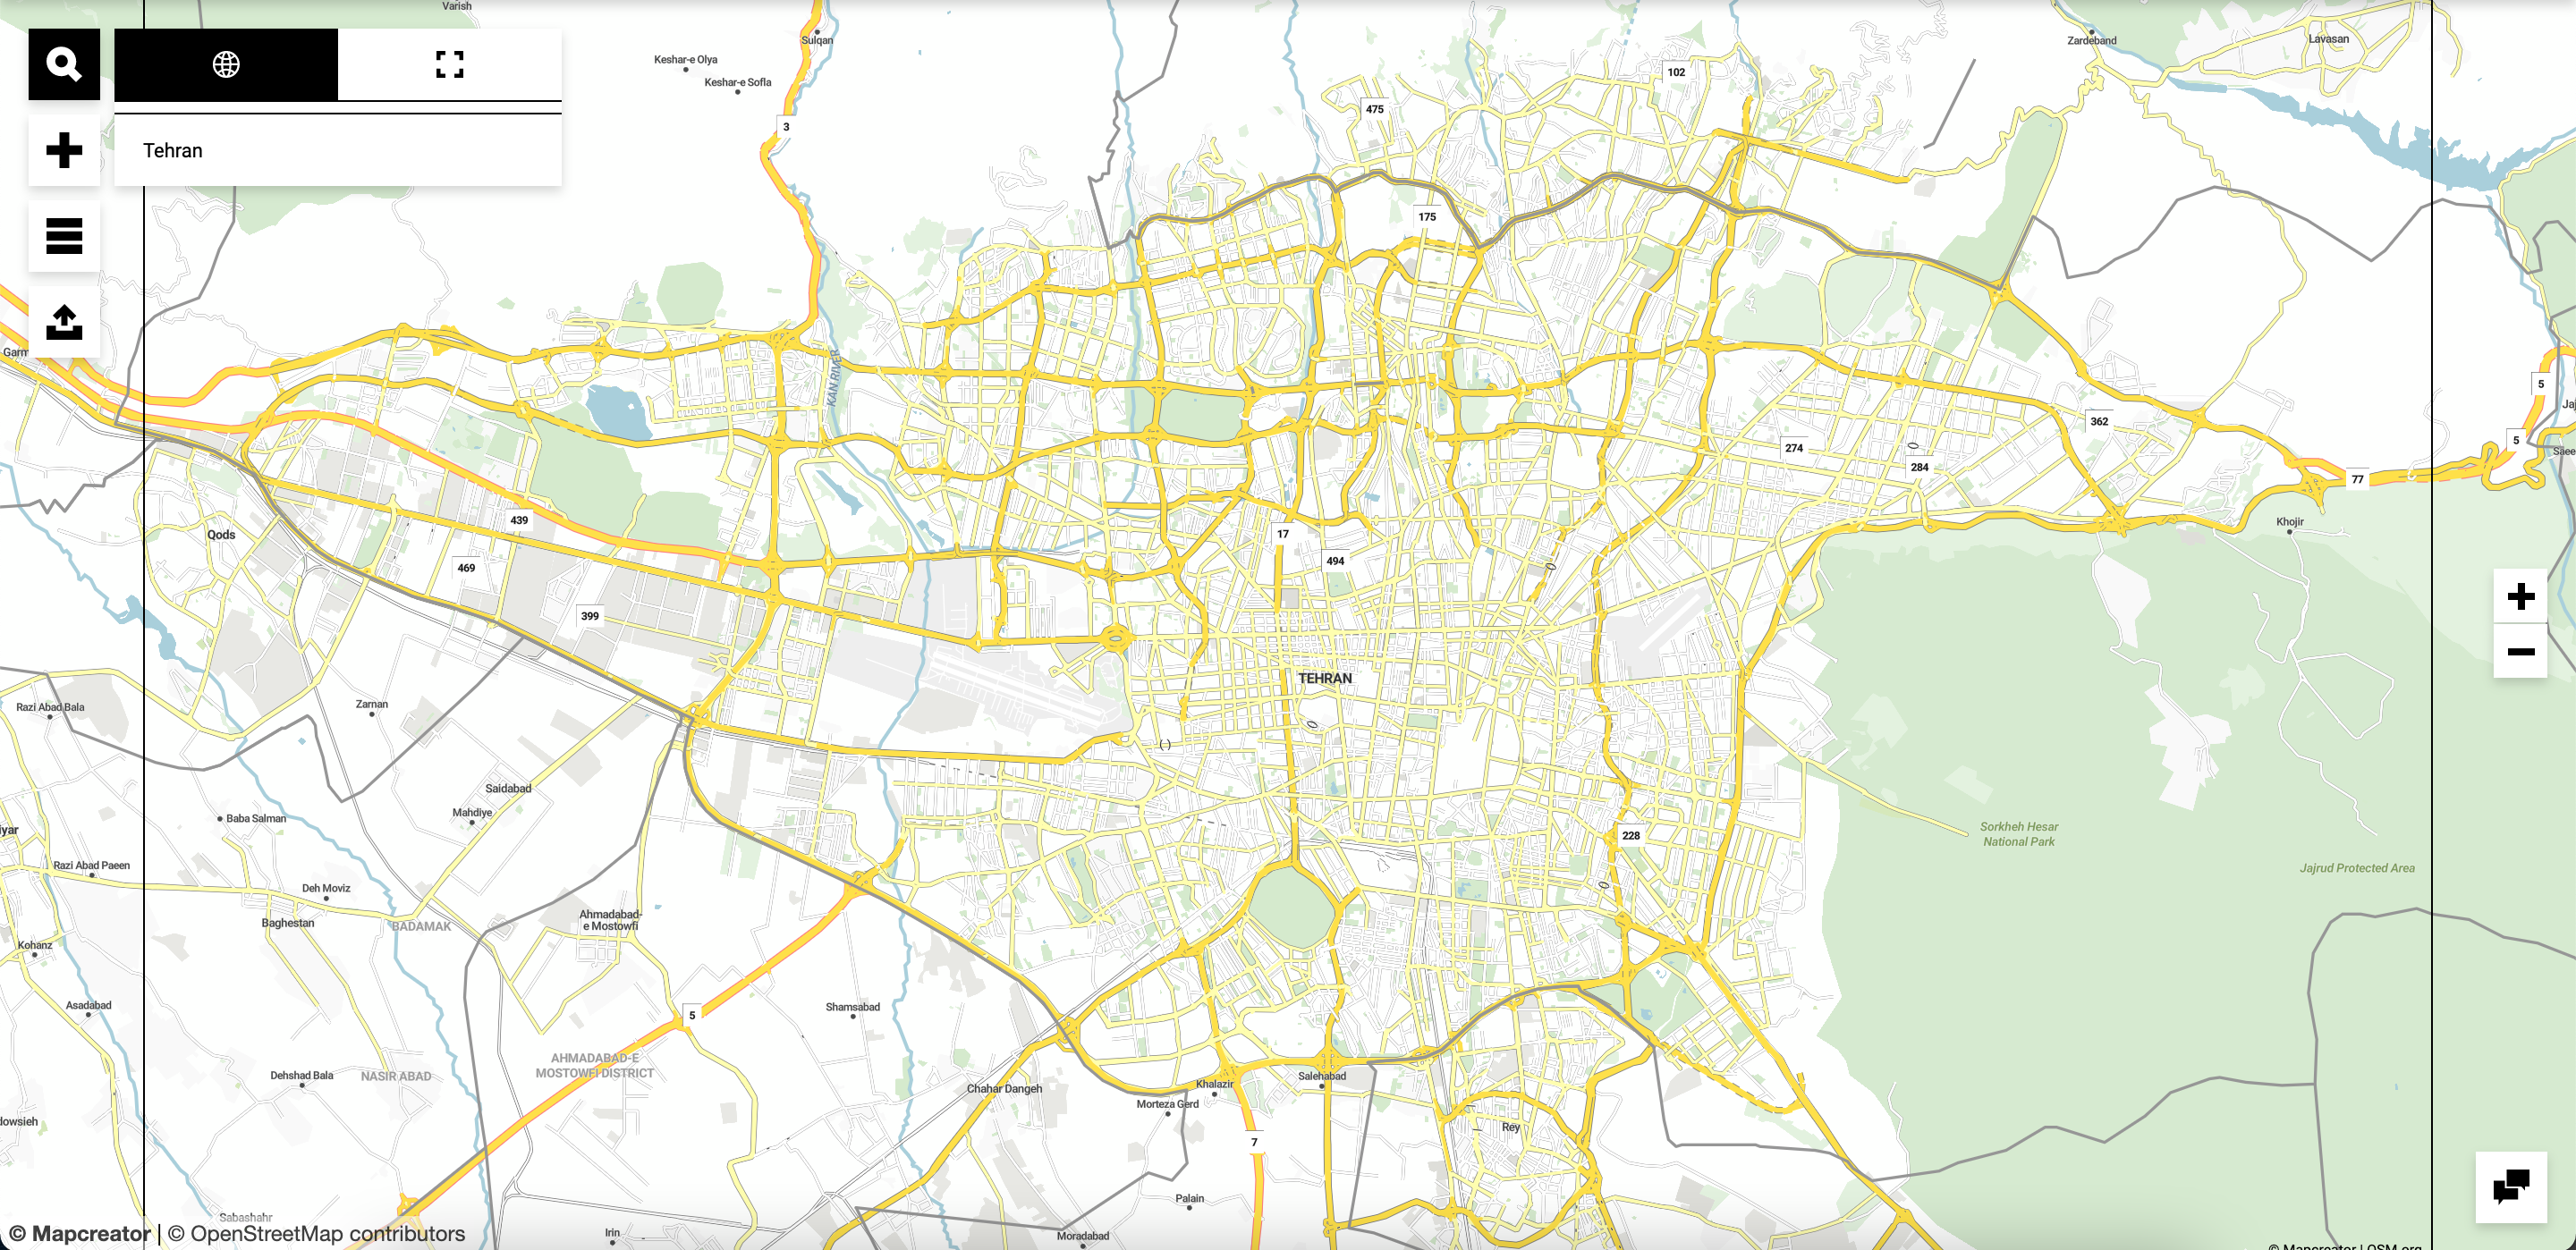
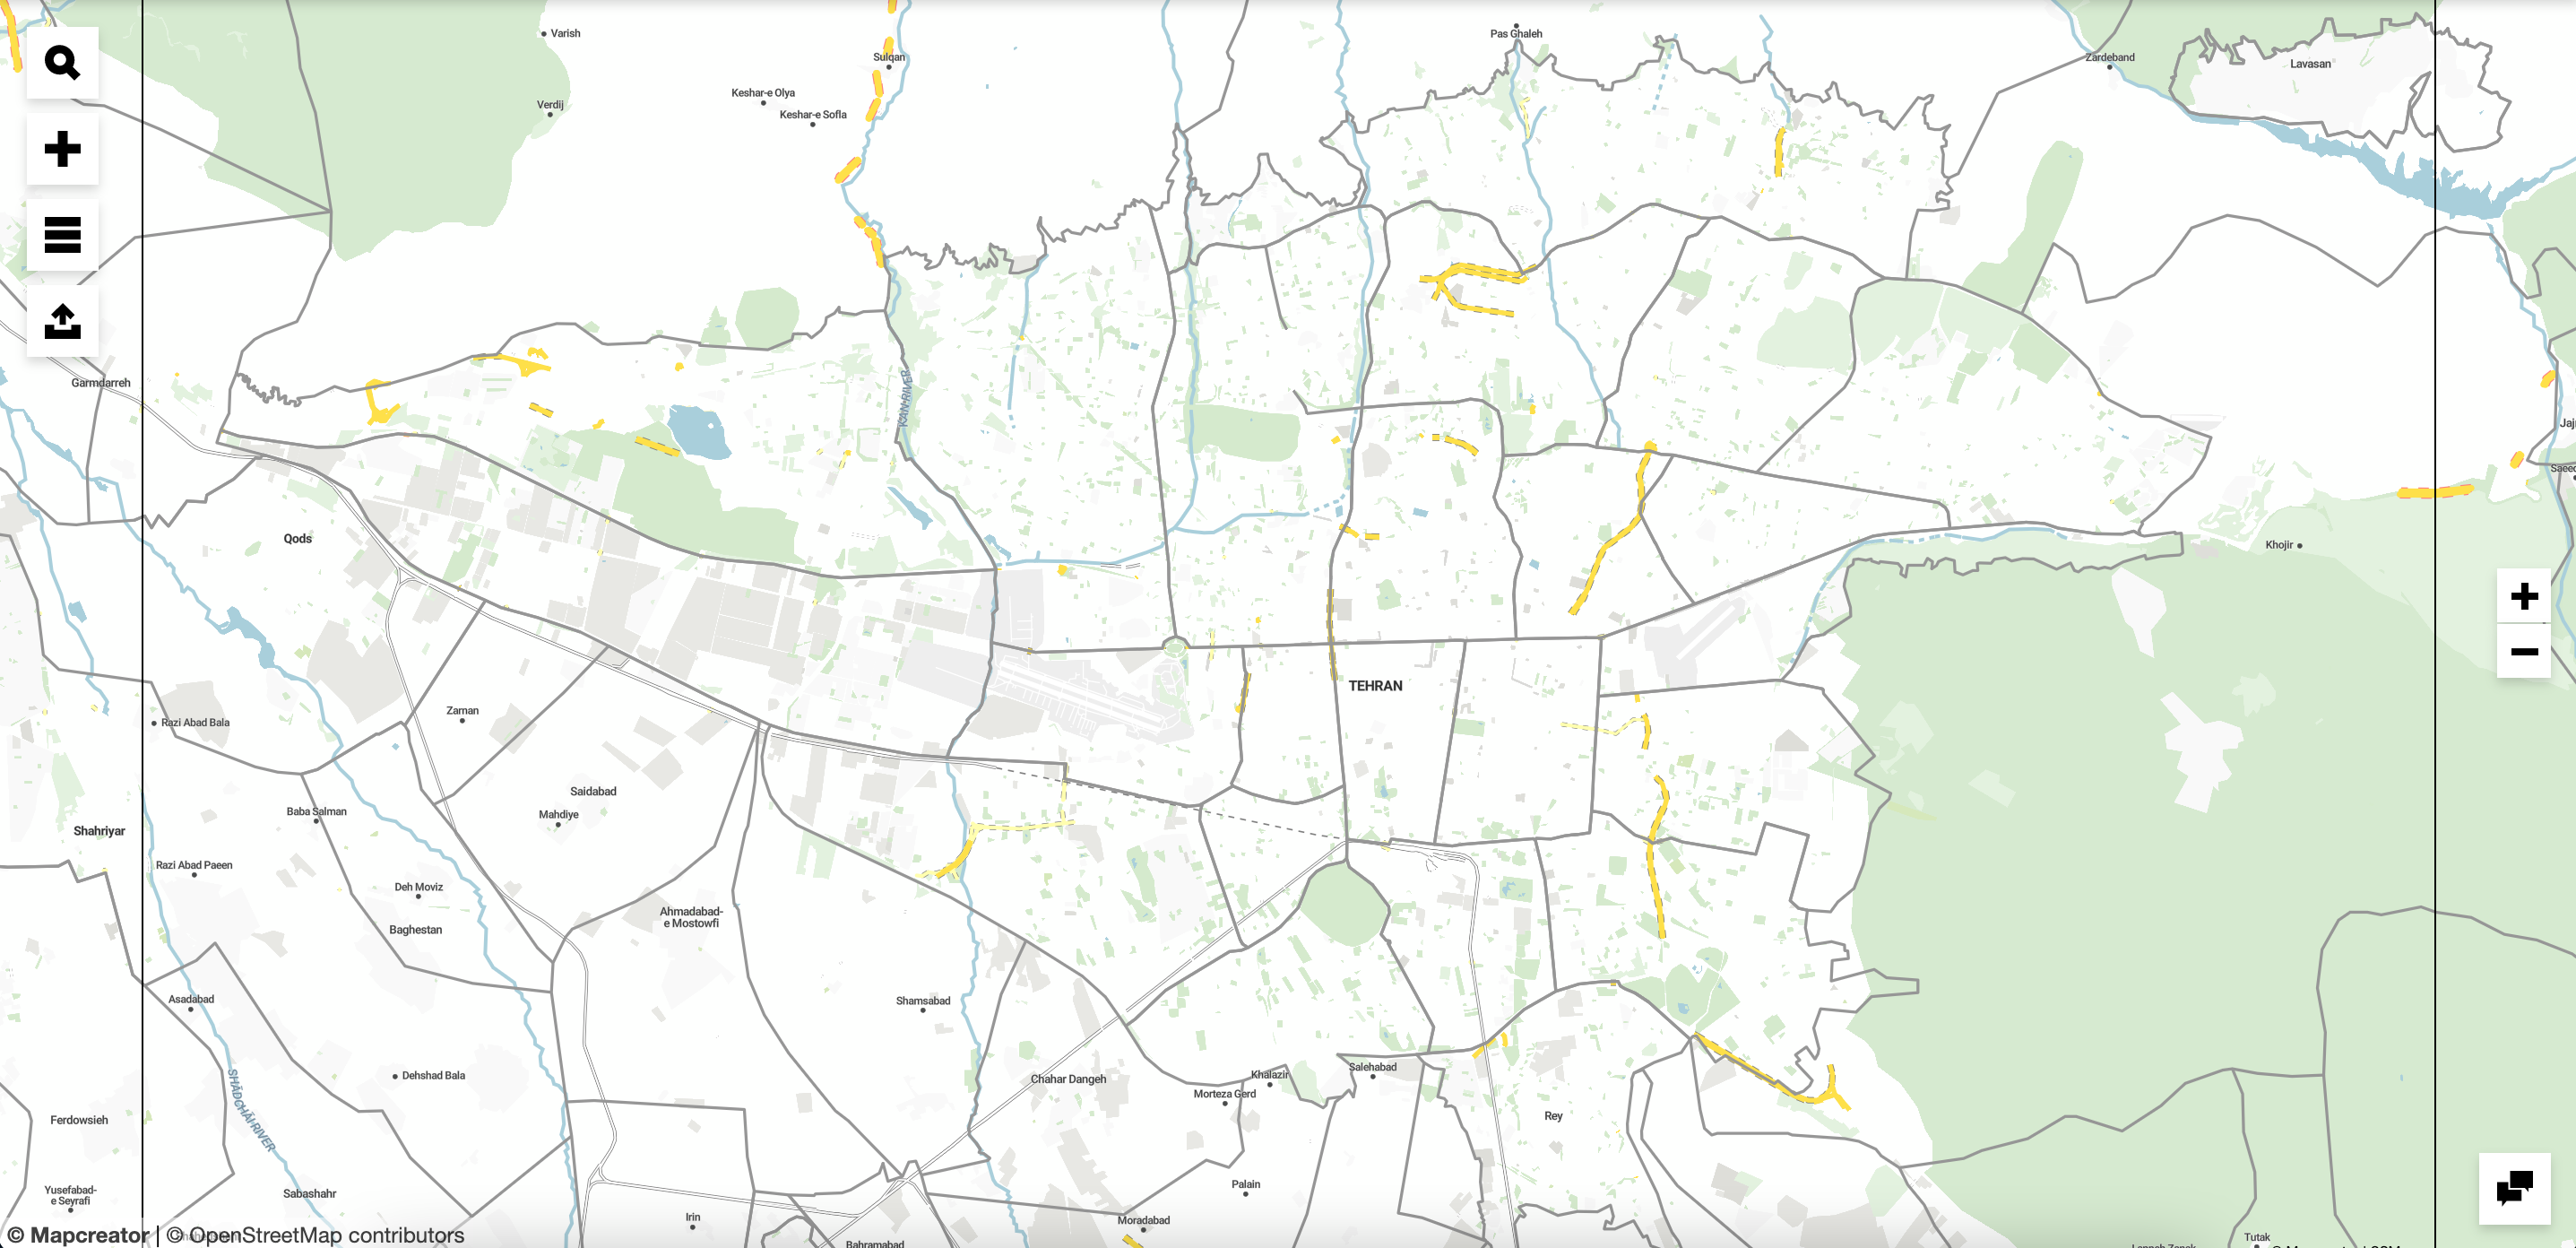
I went to Google Earth and analyzed 3 cities. Vancouver (North-America), Tehran (Middle East), and Oslo (Europe). Zooming in and out, I tried to roughly differentiate the urban vs non-urban spaces and as I already could tell, Tehran lacked significant amount of greenery compared to the other two cities.
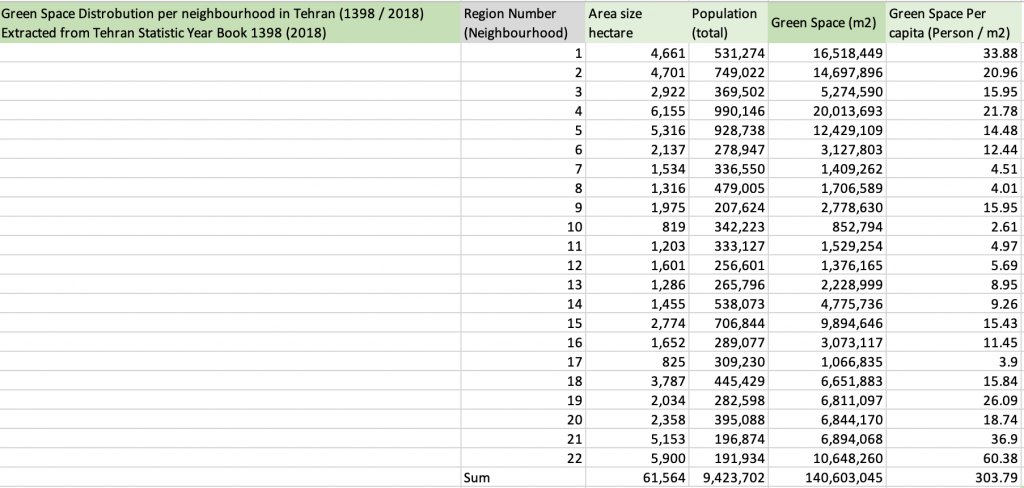
I started to take a closer look at numbers. How is green space measured in cities? I looked at several articles and reports but there were no recent work on Tehran’s urban green space. So I decided to dig dipper and got my hands on the latest public Tehran’s Statistical Year Book (2018-2019).
https://tmicto.tehran.ir/Portals/0/Document/Amarname/NEW_PDF/AmarShahr/98-TehranStatisticalYearBook.pdf
After getting these numbers I already had information on Green Space Per Capita in each zone, but for them to be noticeable I decided to visualize them.

// libraries
import processing.pdf.*;

// global variables
String csv[];
String myData[][];
int x=0;
int y=0;
PFont f;


//Setup
void setup() {

  size (1200, 800);
  background(255);
  noLoop();
  f = createFont("Avenir-Medium", 12);
  csv = loadStrings("Green_Tehran.csv");
  myData = new String [csv.length][2];

  for (int i=0; i<csv.length; i++) {
    myData[i] = csv[i].split(",");
  }
  println(myData[2][1]);
}


//Draw

void draw() {
  beginRecord(PDF, "TehranUGS.pdf");
  noStroke();


  for (int i=0; i<myData.length; i++)
  {
    fill(47, 139, 17);
    float percapita = 40*sqrt(float(myData[i][1]))/PI;
    int xloc=width/10+x;
    int yloc=200+y;
    ellipse(xloc, yloc, percapita, percapita);
    x=x+100;
    if (x>1200) {
      x=0;
      y=200;
    }
    if (i<23 && i>0) {
      fill(0);
      textMode(MODEL);
      textFont(f);
      text(myData[i][0], xloc, yloc+percapita);
      text(myData[i][1], xloc, yloc+percapita+20);
    }
  }
  fill(0);
  ellipse(width/2, 600, 40*sqrt(9)/PI, 40*sqrt(9)/PI);
  text("Minimum Urban Green Space UGS (9 m2)", (width/2 + (40*sqrt(9)/PI)), (600+(15*sqrt(9)/PI)));

  ellipse(width/2, 700, 40*sqrt(50)/PI, 40*sqrt(50)/PI);
  text("Ideal Urban Green Space UGS (50 m2)", (width/2 +(40*sqrt(50)/PI)), (620+(35*sqrt(50)/PI)));
  ;


  endRecord();
  println("PDF saved");
}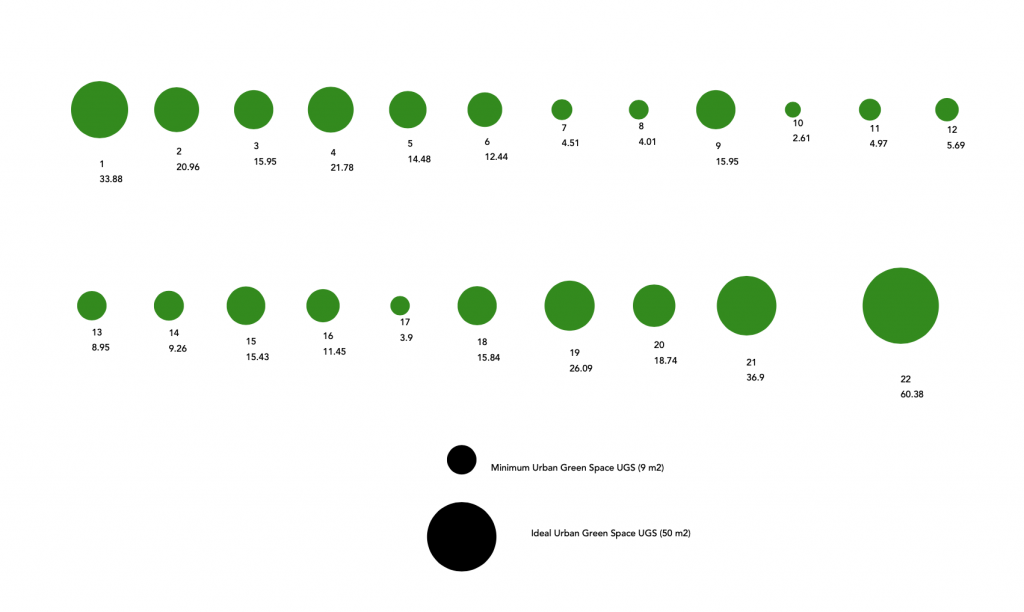
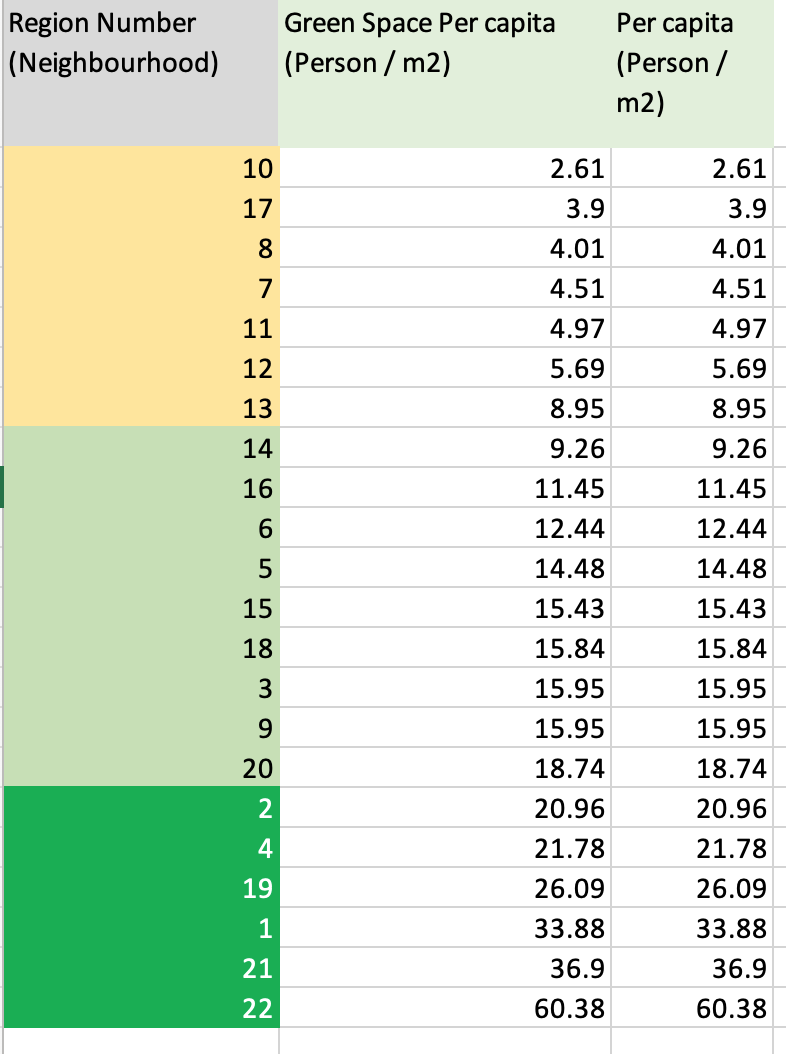
UGS Standard
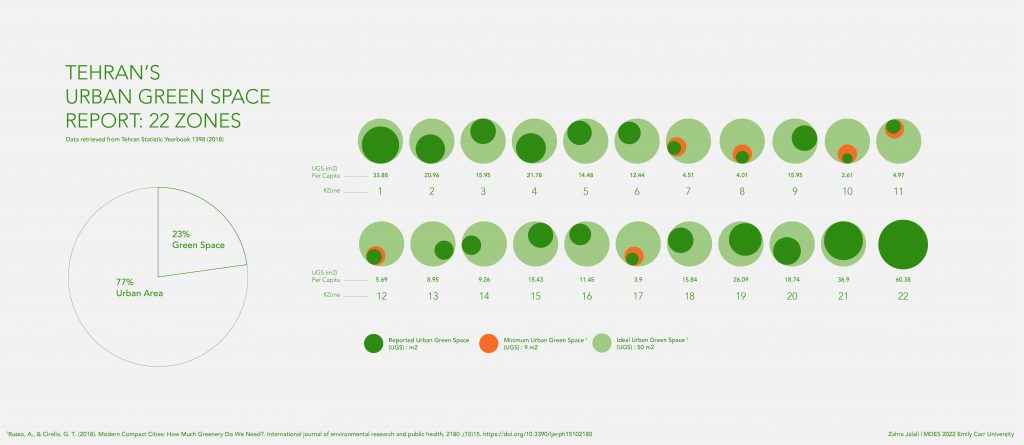
In an urban setting, we need at least 9 m2of green space per individual with an ideal UGS value of 50 m2 per capita. (Russo, Criella, 2018) I decided to use this numbers to measure the existing statistics on Tahran.
Russo, A., & Cirella, G. T. (2018). Modern Compact Cities: How Much Greenery Do We Need?. International journal of environmental research and public health, 15(10), 2180. https://doi.org/10.3390/ijerph15102180
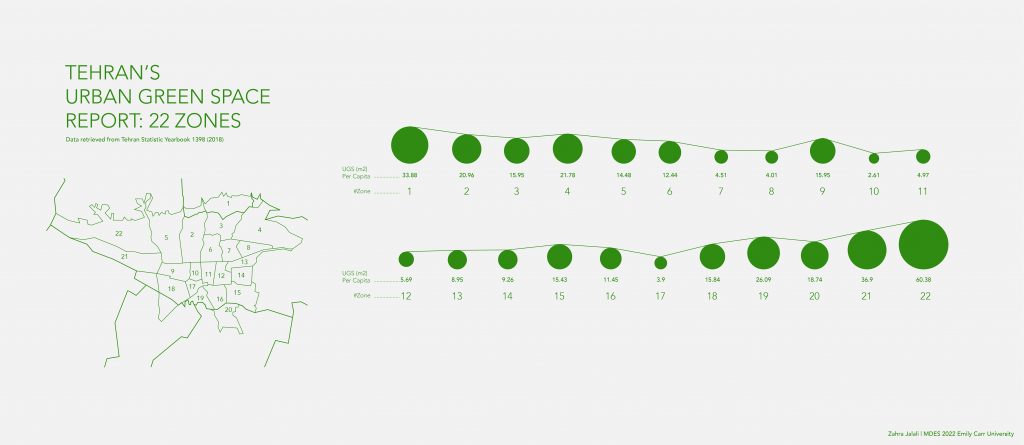
Tehran’s Urban Green Space Report:
22 Zones
The first visualization indicates the frequency of UGS in 22 zones. As can be seen, the neighborhoods show significant discrepancies in terms of nature accessibility.
<Click to enlarge>
The 2nd visualization was designed to showcase the insufficient UGS in each zone compared to minimum and ideal numbers.
Tangible Visualization
At the end of this project, I went to a local park for a walk and as I was thinking about the UGS values, I decided to visualize its unit in a physical format.
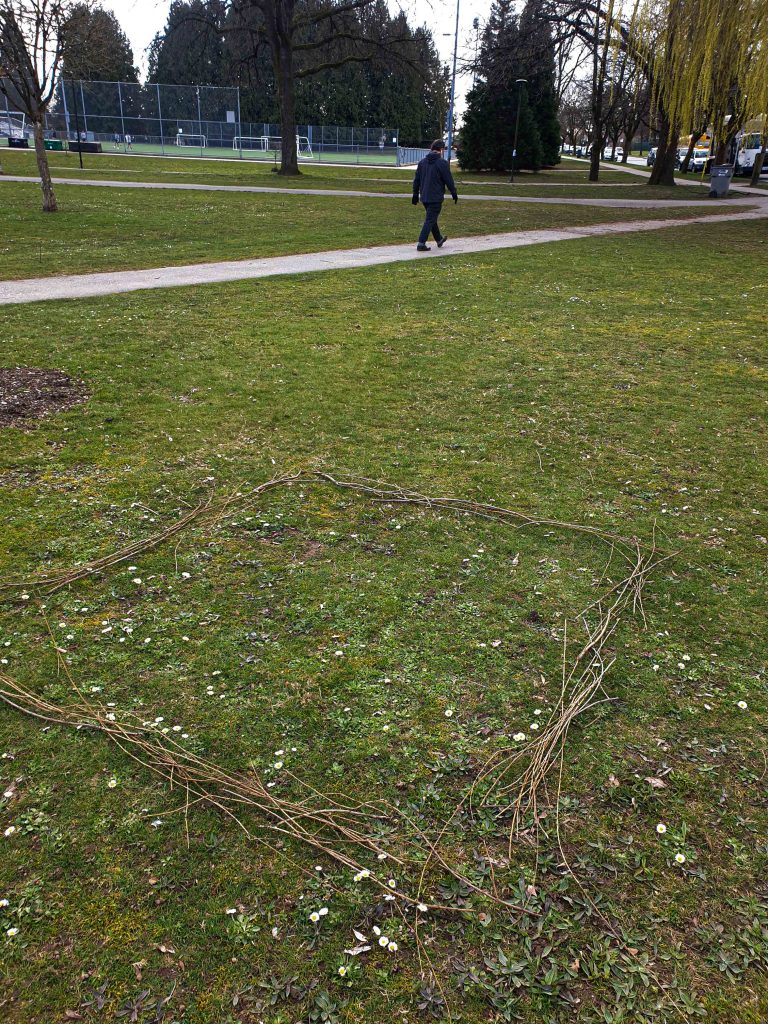
2 * 2 m 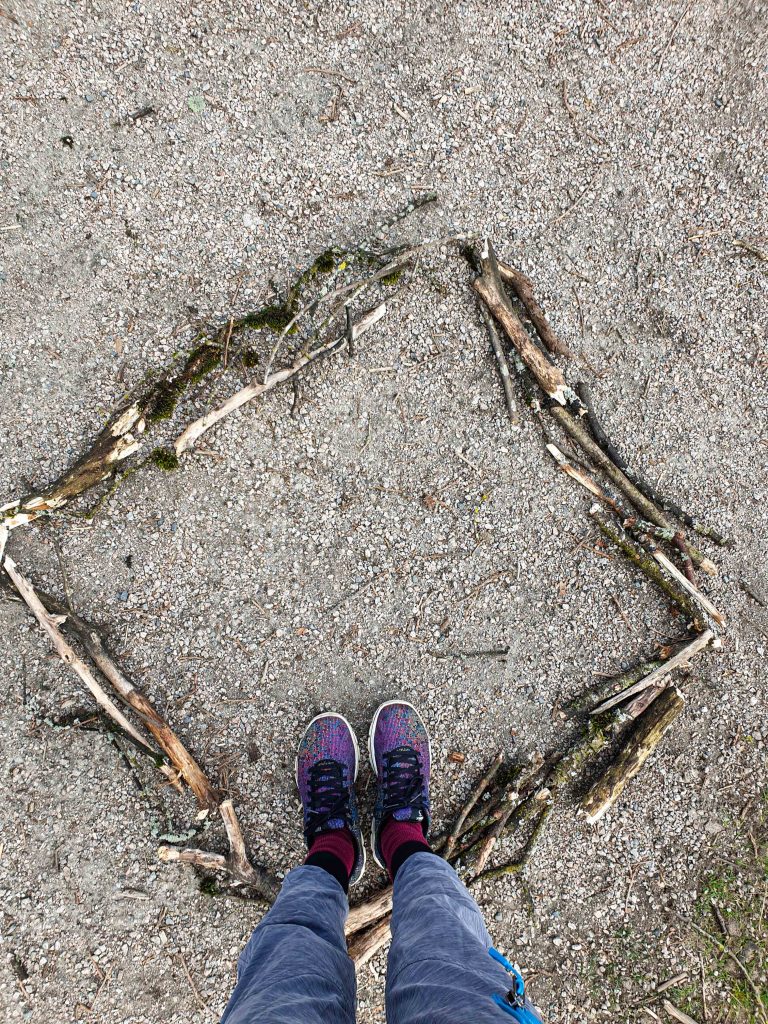
1 * 1 m 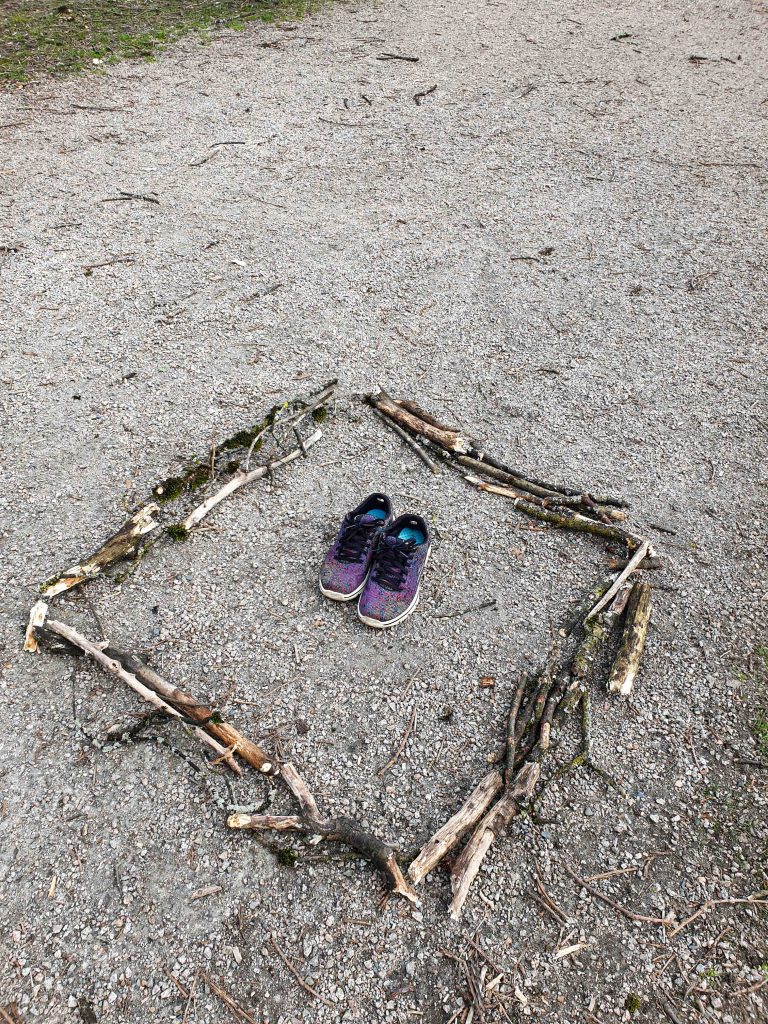
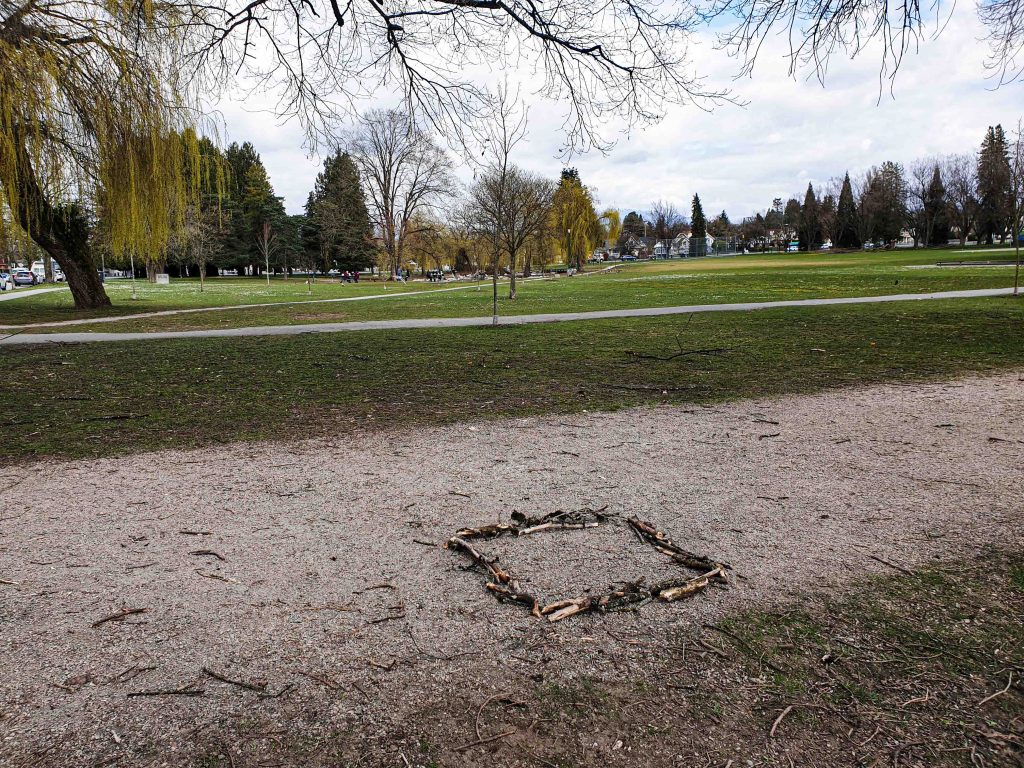
In Tehran’s UGS report, there was a zone with a 2*2 m UGS value. Meaning in that neighborhood, there’s only a 2*2 m natural space allocated to each resident. Seeing this limited space in the real world rather than solely on a screen created a much more meaningful communication. Especially when the location is Vancouver, a reach city in terms of flora & fauna which has a policy in action to be the greenest city in the world.
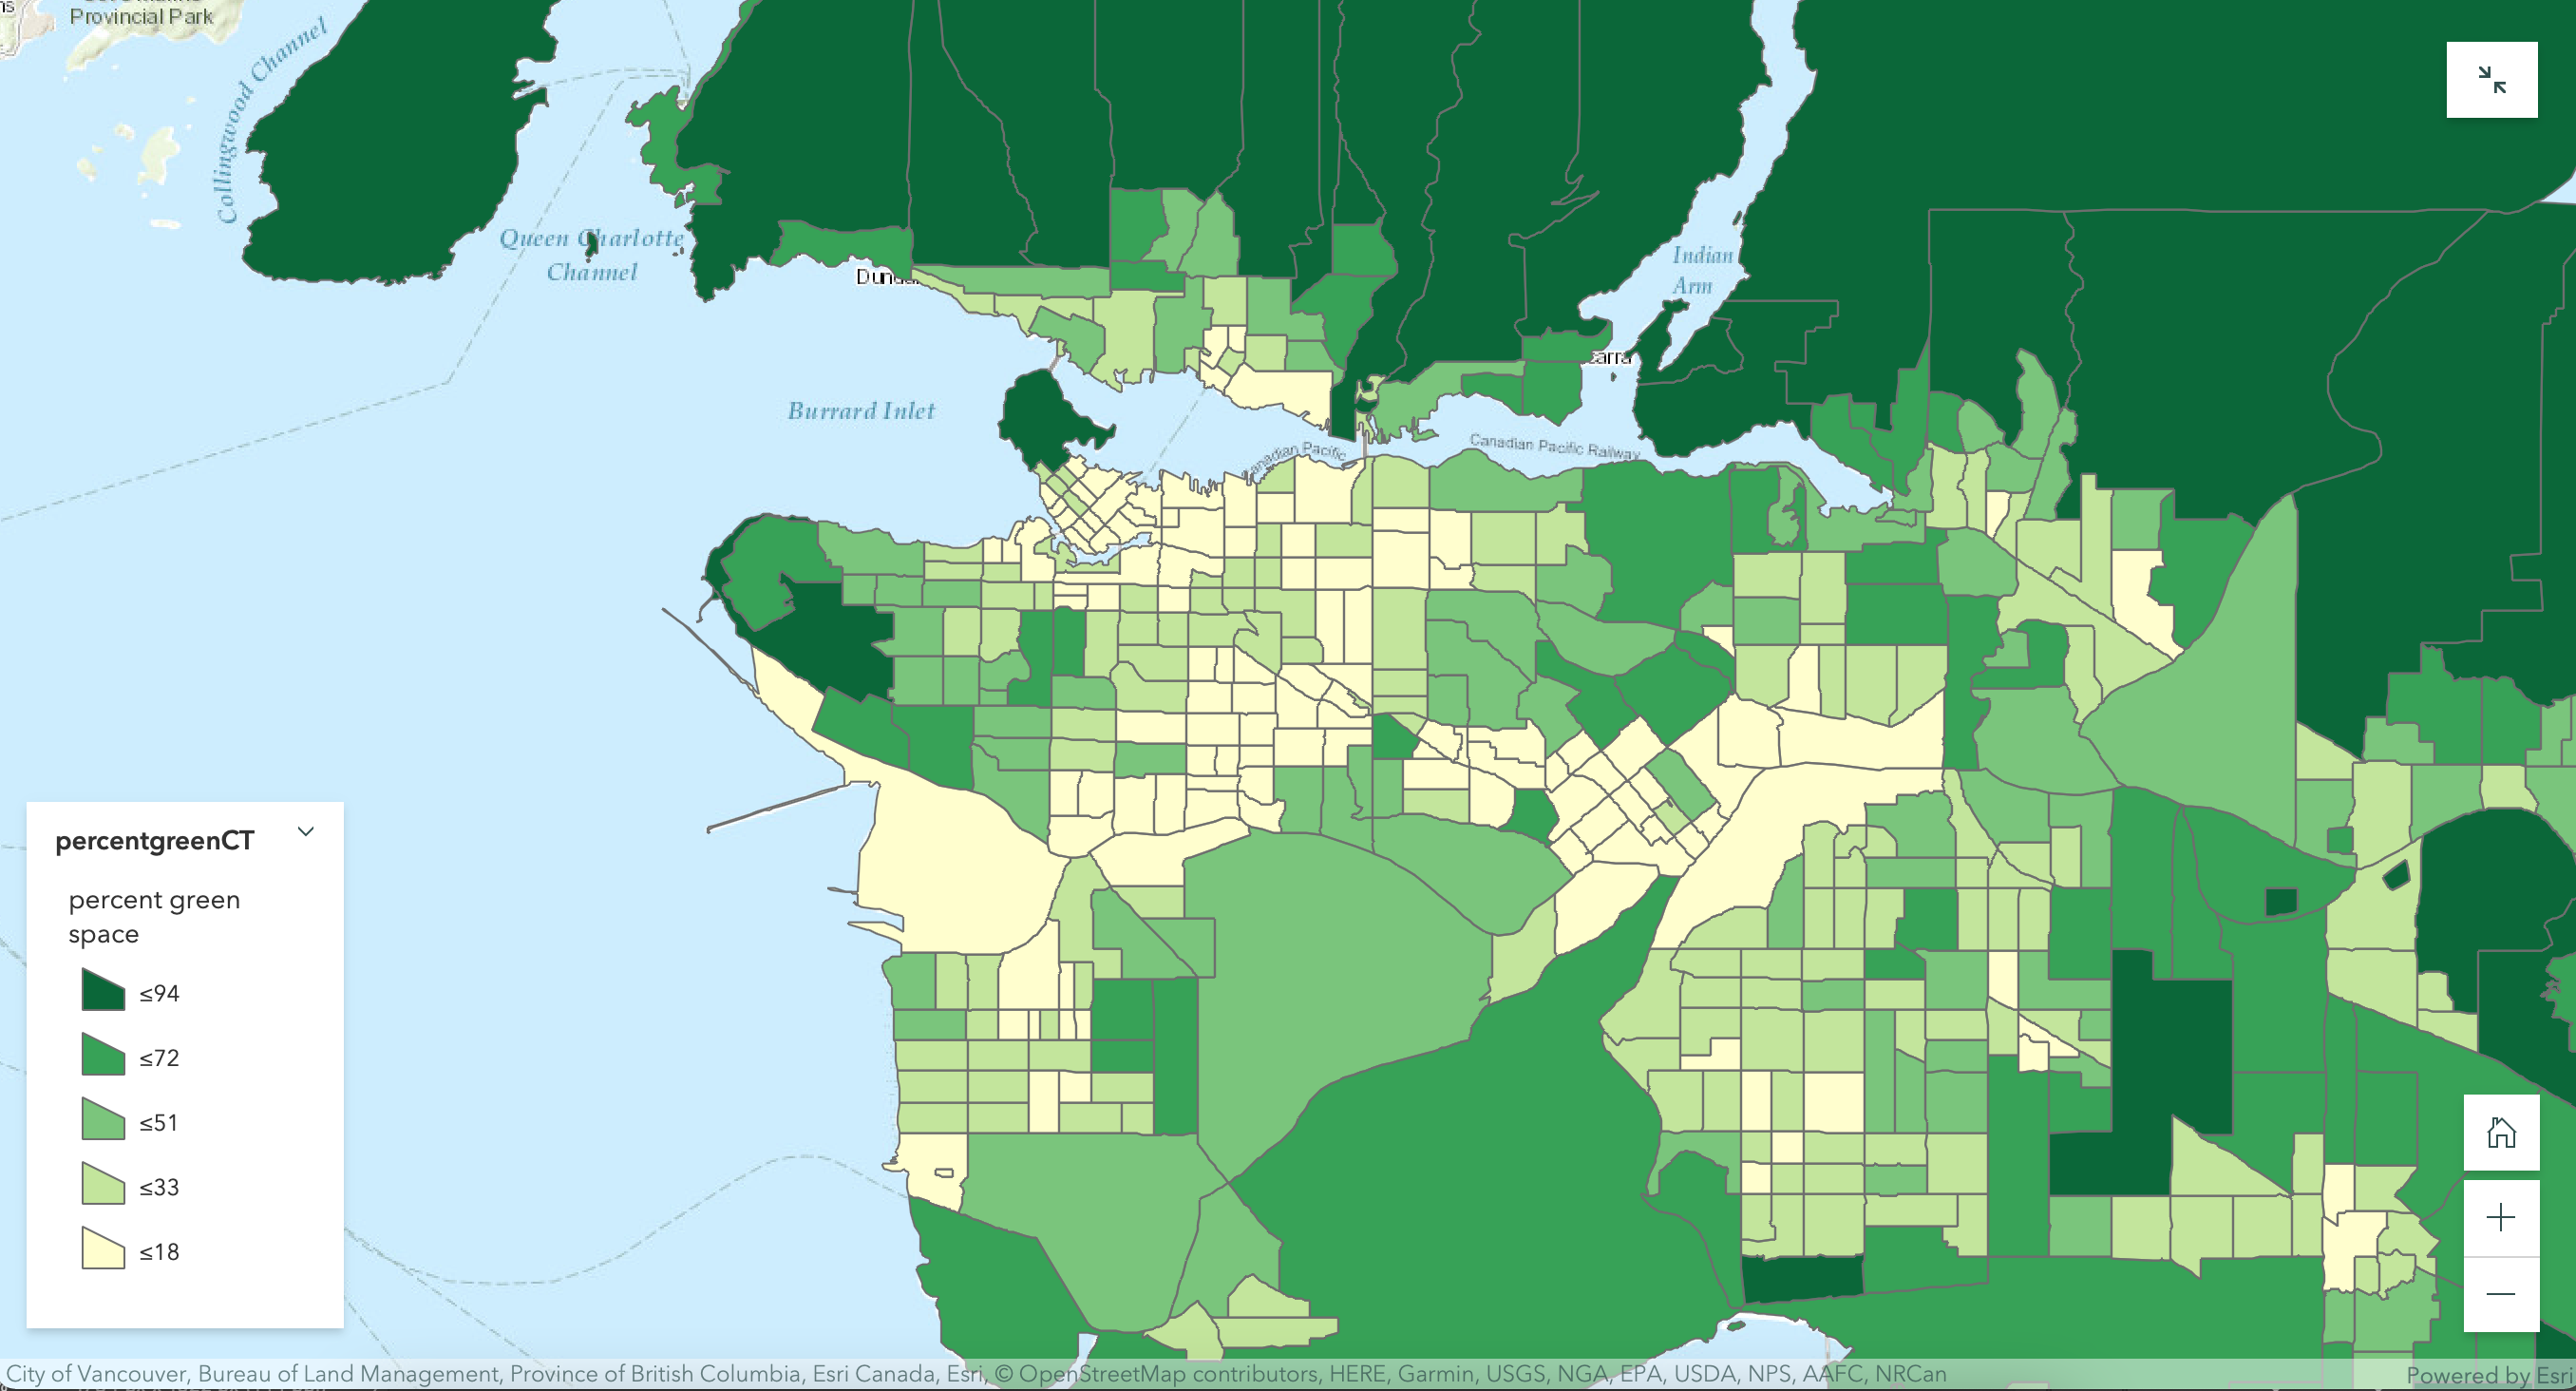
This map presents percentage of green space by Census Tract in Metro Vancouver, BC Canada. / https://storymaps.arcgis.com/stories/0706abfb4f9942259794f9811c00eee2
There are numerous studies that indicate the benefits of having access to nature (Fitzgibbons, 2020, p. 8) and yet, many people are deprived of that either by geographical limitations or accessibility issues. This problem can be tackled from numerous angles, planting trees would be the most basic one, but from an interaction design perspective, what are the other ways we can experience nature? We can’t always re-wild a city or create a jungle in a dry urban area, but how else we can facilitate nature experience, even if people are not directly in contact with a natural environment? Nature is vast, both in meaning and element, can interaction design help us find nature and connect with it?