Data Annotation
For this action, I wanted to visualize data that was complex. I wanted to explore how can something complex be presented in an engaging fashion. While reading an article on data visualization, I got the idea of visualizing the value of ‘Pi (22/7)’. I chose the value since it is a non-repeating irrational number.
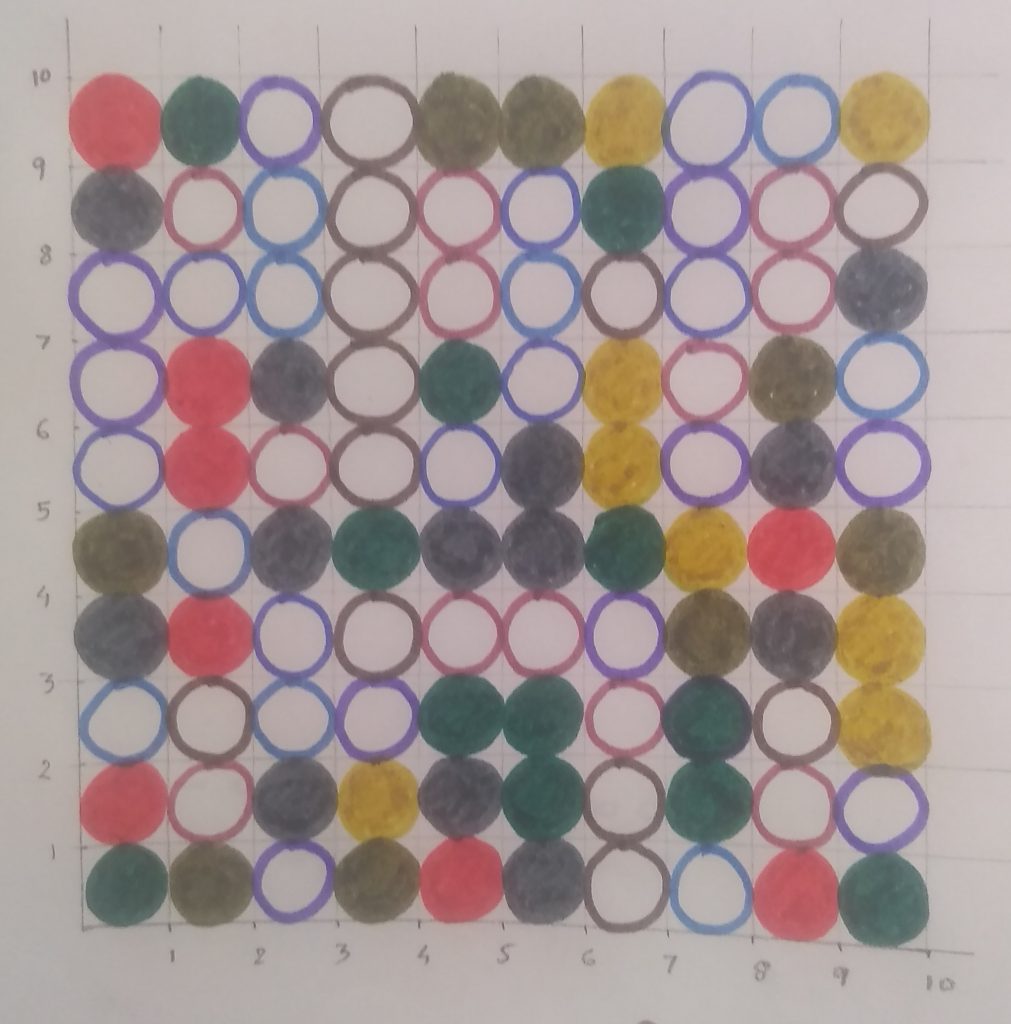
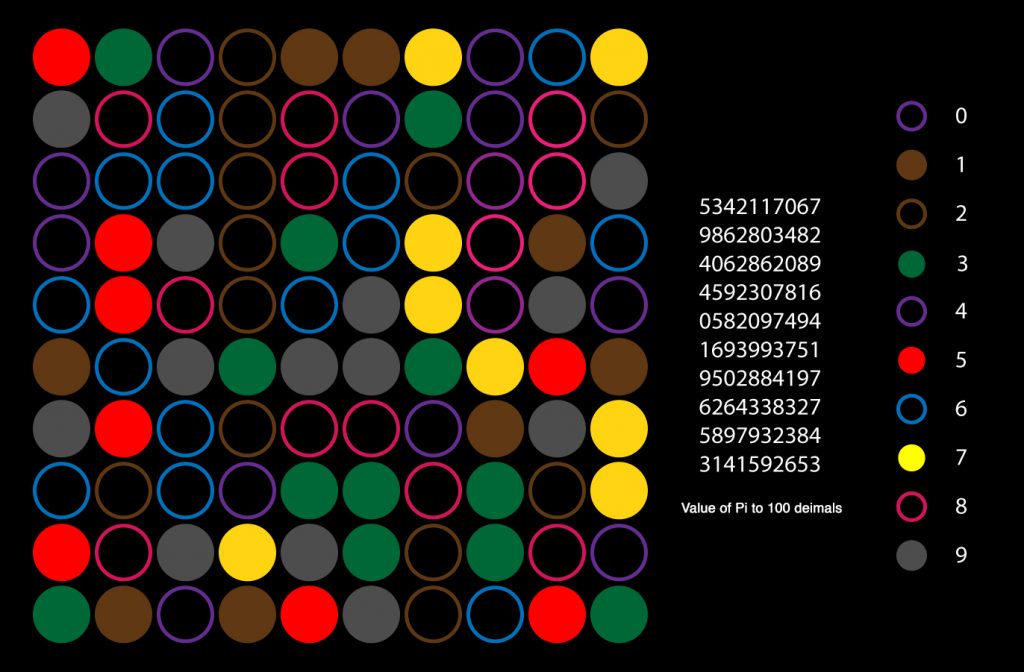
The value of pi can go on to infinity so, I decided to visualize the value only to the first 100 decimals. I started by annotating each digit (0-9) with different kinds of circles (hollow for even numbers and solid for odd numbers). Next I decided to annotate each digit with a particular color. Since I was only visualizing the value to the first 100 decimals, this meant i could complete the visualization in a grid of 10×10.
Once I had completed annotating the digits individually, I started building the grid. As I did that, some patterns already started to emerge. It made it look like a Chinese checkers board.

To make a finer version of this, I replicated the same data and visualized it on the computer. Once I completed this, I could see a beautiful pattern of digits and annotations that was certainly more engaging than just a bunch of digits going on for infinity.

Having done this action, I want to see if data annotation can be used to make even more complex data accessible and engaging, a question that has been on my mind since I read some works of Giorgia Lupi.