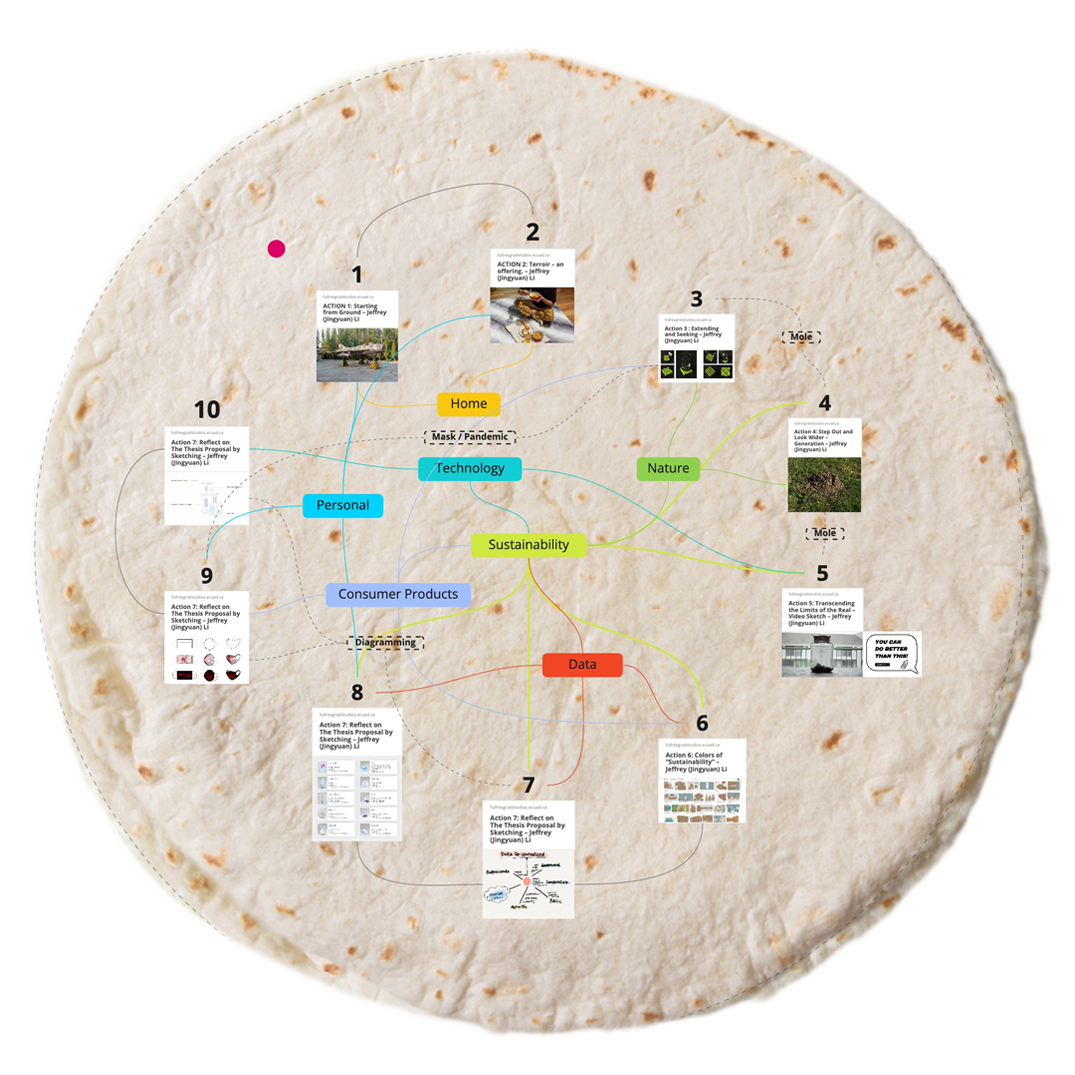
Recently I got to experience the power of making diagrams through assignments in the research method course. It is a great tool to summarize and connect scattered thoughts. In this action, I made a diagram in a form of a circle that summarizes the topics covered by past actions, as well as how they are related.
These actions helped me in forming inquiries in subjects that I’ve always been interested in. Almost all of them were processes of exploration, without forming a definitive result. At first, this aspect was a little upsetting to me, but later on I learned to accept that. In fact, I learned most from the ones in which I didn’t look for a set answer from the beginning.
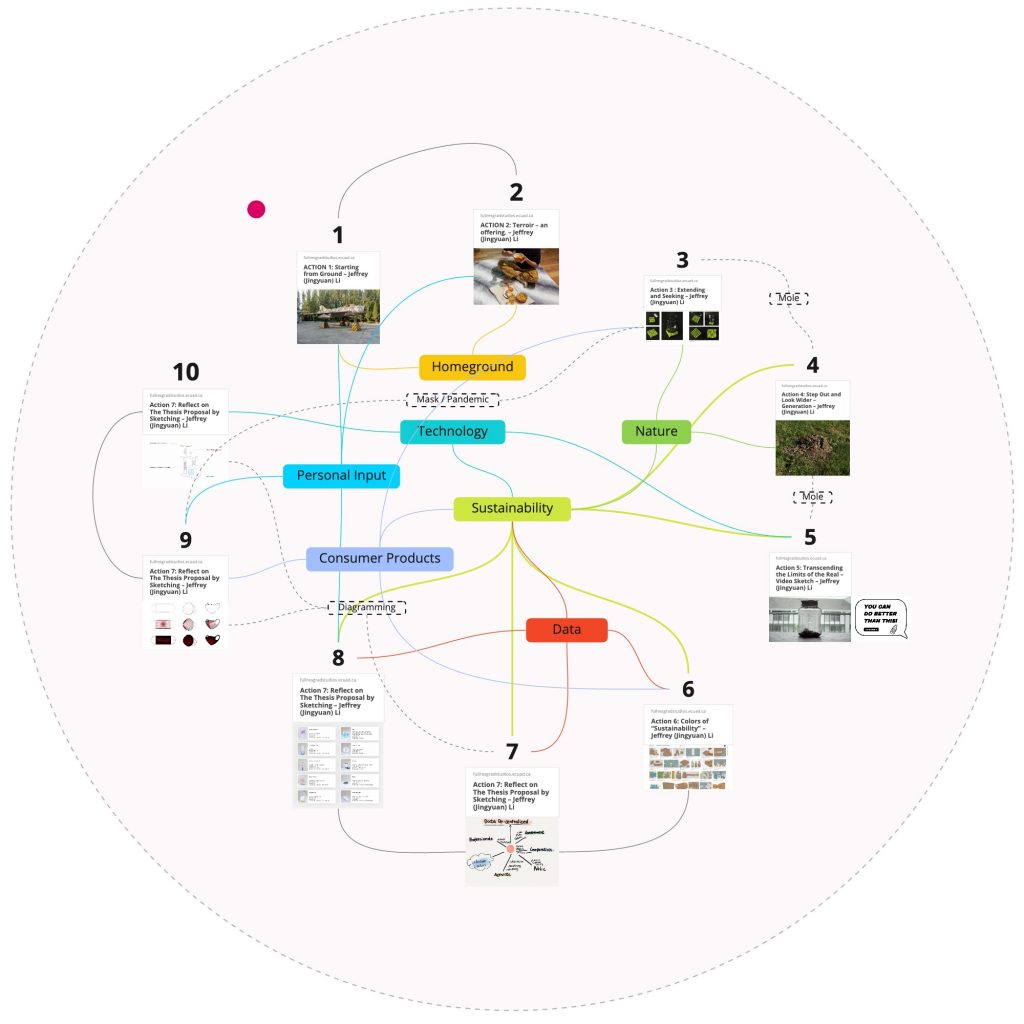
Looking back, these 10 actions generated a number of topics that are inter-related: technology, sustainability, data, personal input… and they form a kind of network that gives space for new topics, or deeper investigations. I am going to make reference to these actions when working toward the thesis.
I have two distinct directions for my thesis, and in this semester so far I had only explored one of them. Being stuck on one direction made me want to take a break from it. In this action, I went to explore the issues around Social Media.
Many new inventions in the past had been criticized at their birth for different reasons, famous examples being bicycle, automobile, and television. As time passed and people get benefitted from them, the initial concerns would fade away. Will it be the same case for Social Media? We don’t know yet. However, its popularity has reached further than those older inventions, while using way less time. At this time, Social Media is a changing medium, controlled by monopolies that are often marked by manipulative, dark patterns.
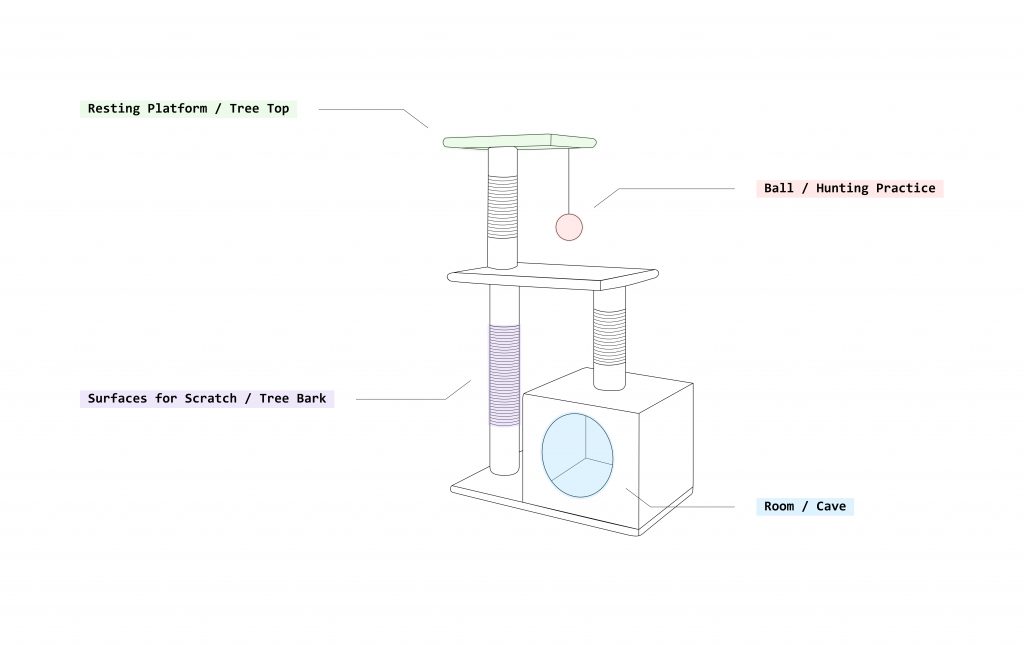
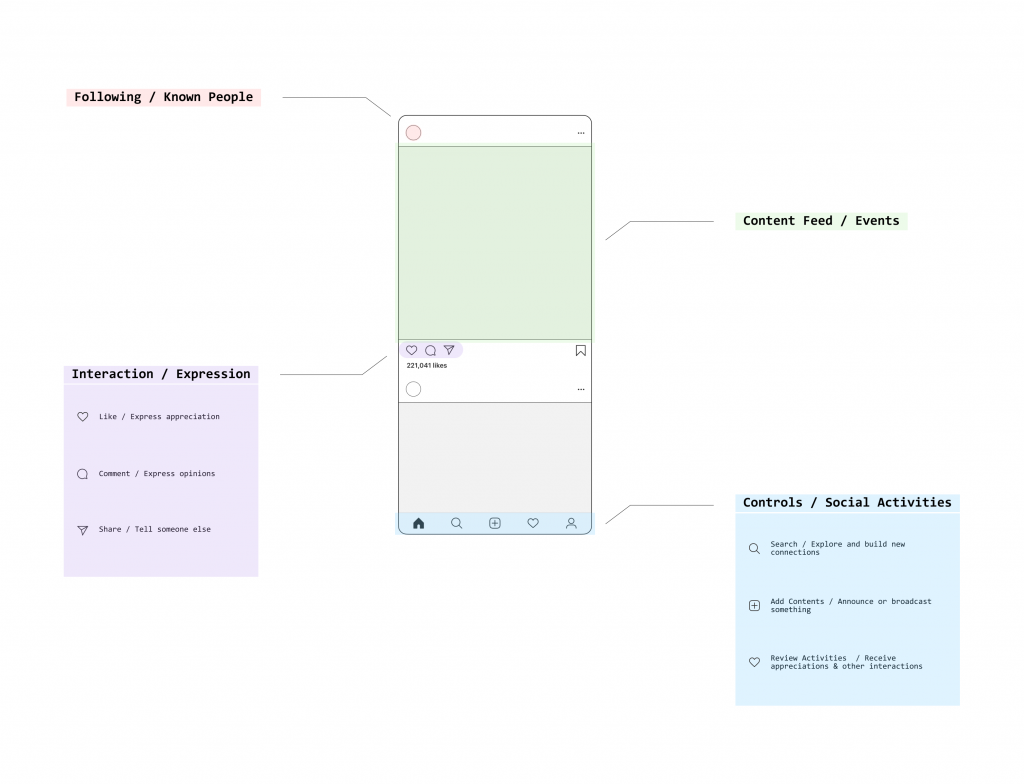
I want to look at how social media turns actual social interaction between human into a product. This lens has led me to think social media as a mirage for the reality. The function of social media can be compared to a cat tree, which is a mimic of cats’ ancestors living environment in the nature. Cat trees were patented by Frank Crow in 1968, Los Angelas, featuring a wooden column with several platforms. Today, there aren’t any changes to its fundamental form, but the common ones are often covered with soft materials, with fluffy toys hanged by a string.
To make the comparison, I took apart the components of a common cat tree and illustrated the function of each component. The industrialized product looks nothing like a real tree, but provides a range of features to support behaviors of a cat. The resting platform imitates tree branches high above the ground, allowing cats to sleep and relax; The hanged fluffy ball looks like a mouse that cat likes to chase and play with; Rough surfaces made with nylon ropes fulfill the cat’s need to scratch; A darkened space for cats to hide, just like in a tree-hole or cave. These behavior-oriented designs provides a healthier environment for house cats by catering to their needs – resources and structures that used to be scarce in a human living space.
The same behavior-based design also happens in social media, but in a much more complicated sense. Our natural instincts to socialize and connect are made into virtual interactions, represented by buttons and user interfaces. Similar to cat trees, we feel content when our social needs are met. However, after making the illustrations, I realized one of the biggest difference between social media and a cat tree, is that social media goes beyond just meeting our needs. The platforms would change our behaviors based on the company’s need, for instance, to profit. Knowing this sad fact is helpful because it points me a direction for my later researches, which is to see through social media’s manipulation and return it to a tool for functions that we intended to use.
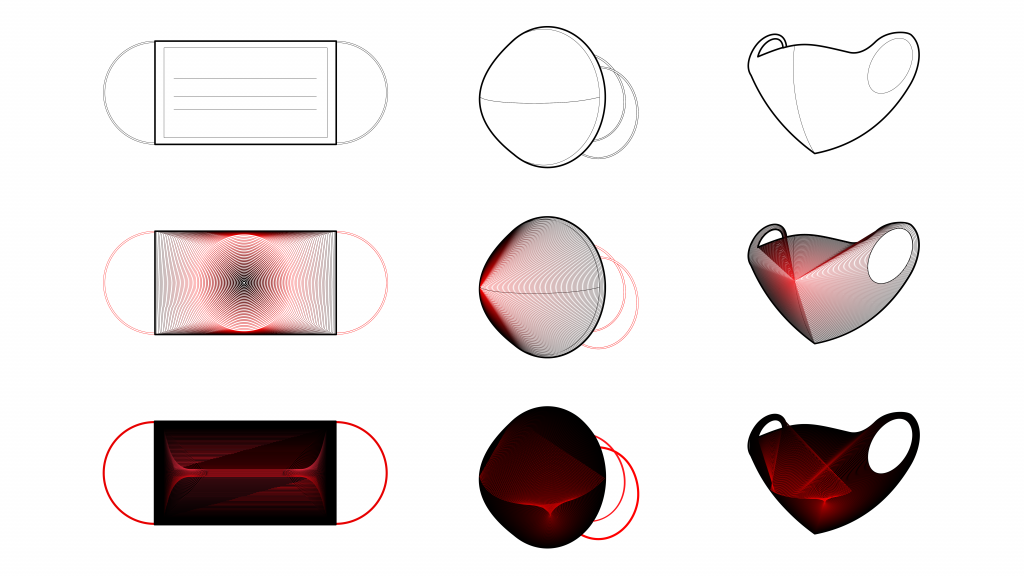
During 2020, the Covid-19 pandemic shaped a variety of “new normals” for the public. Wearing a mask or a face covering is definitely one of the most tactile and close to body experiences. In many countries, masks are required in all public occasions. Healthcare authorities such as CDC have emphasized the significance of wearing masks to help control the spread of virus. Apparently, there is a different voice that declares the mask has no use. Looking at this debate, I would conclude that the public has mixed feelings and specific emotions towards masks. Under the pandemic circumstance, a mask is not just an object or a piece of accessory any more. It symbolizes a cultural and political point of view. The choice of type of mask embodies personal opinions and consciousness towards the pandemic. It becomes an interesting phenomenon to explore and study.
To have a piece of fabric covering the face changes the way we interact with each other; Used masks are suddenly seen as the dirtiest object you can have. The heat trapped inside, the muffled voice, and psychological discomforts altogether, make the mask-wearing experience a not-so-pleasant necessity during the pandemic.
I teamed up with my girlfriend in this action, and each of us illustrated our fear and discomforts when wearing three types of masks.
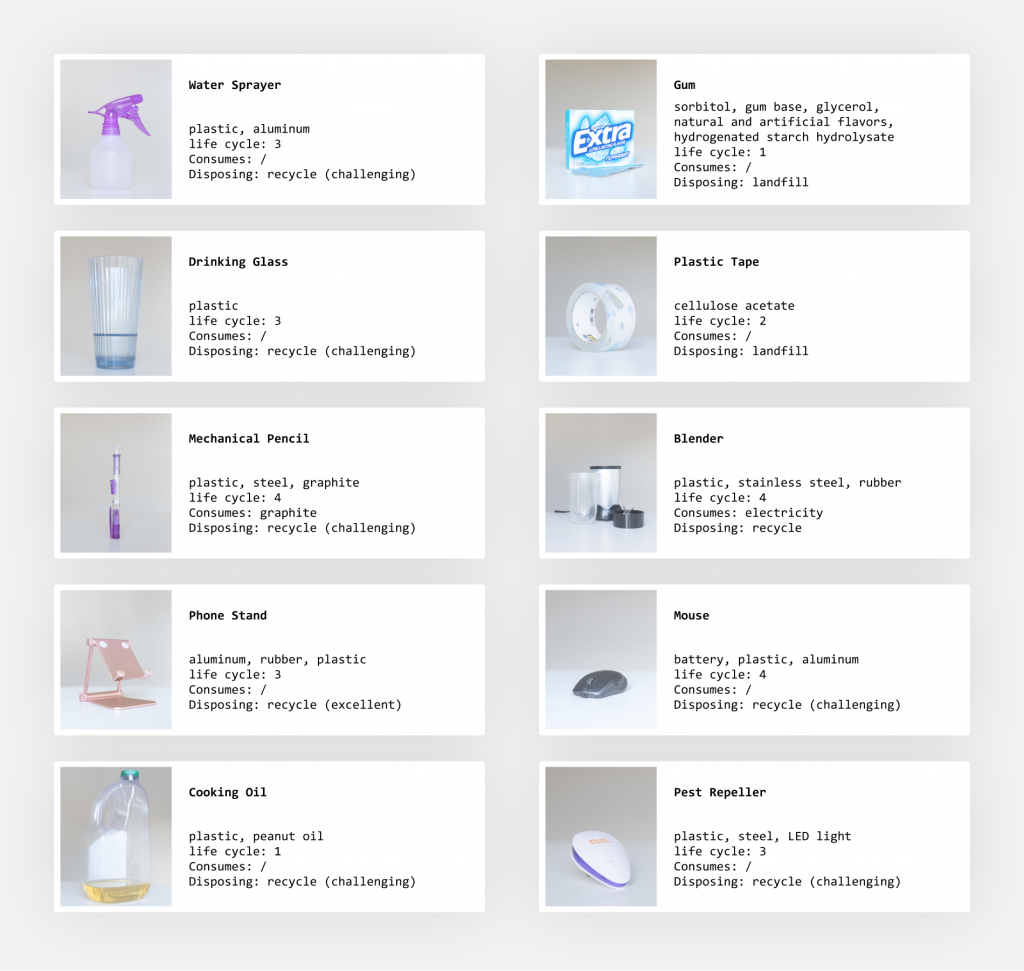
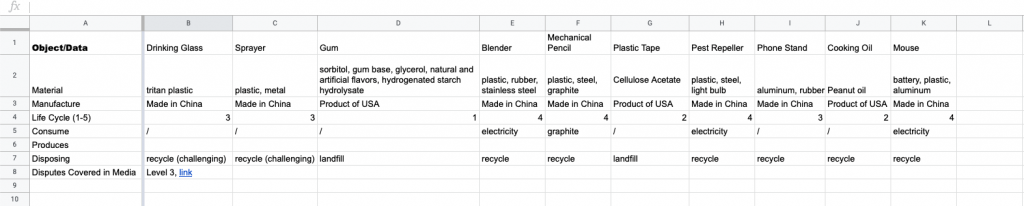
Following last action’s plan, I decided to look at the data of objects around me. Thanks to Zach’s suggestions about looking at data outside of the realm of digital and numerical, I started to look at objects and made my own criteria for collecting data.
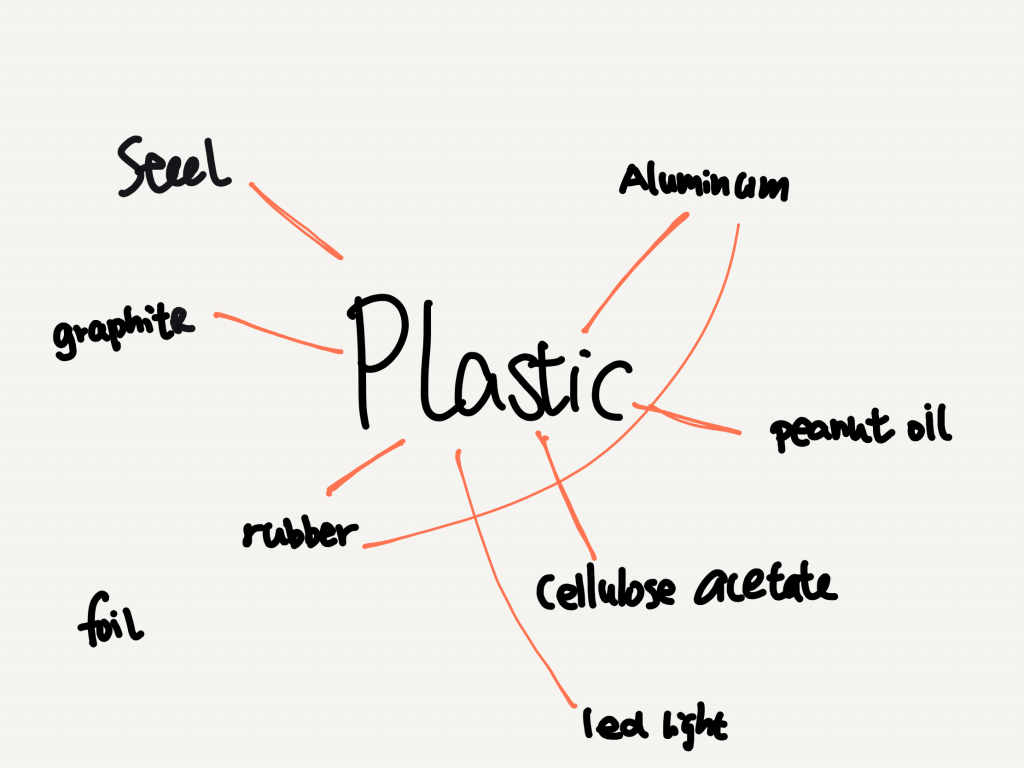
Gathered around 10 small objects, I looked for what they had in common. Turned out, material was a crucial part. Other than that, I decided to evaluate their “life cycles”, that is how quickly these objects will eventually be threw away or lose their intended functions. By creating a grading system that considers its structural complexity, usage frequency / length, and possibility of getting repaired, I assessed the life cycle for each item, ranging from 1 to 5. The results are very informative.
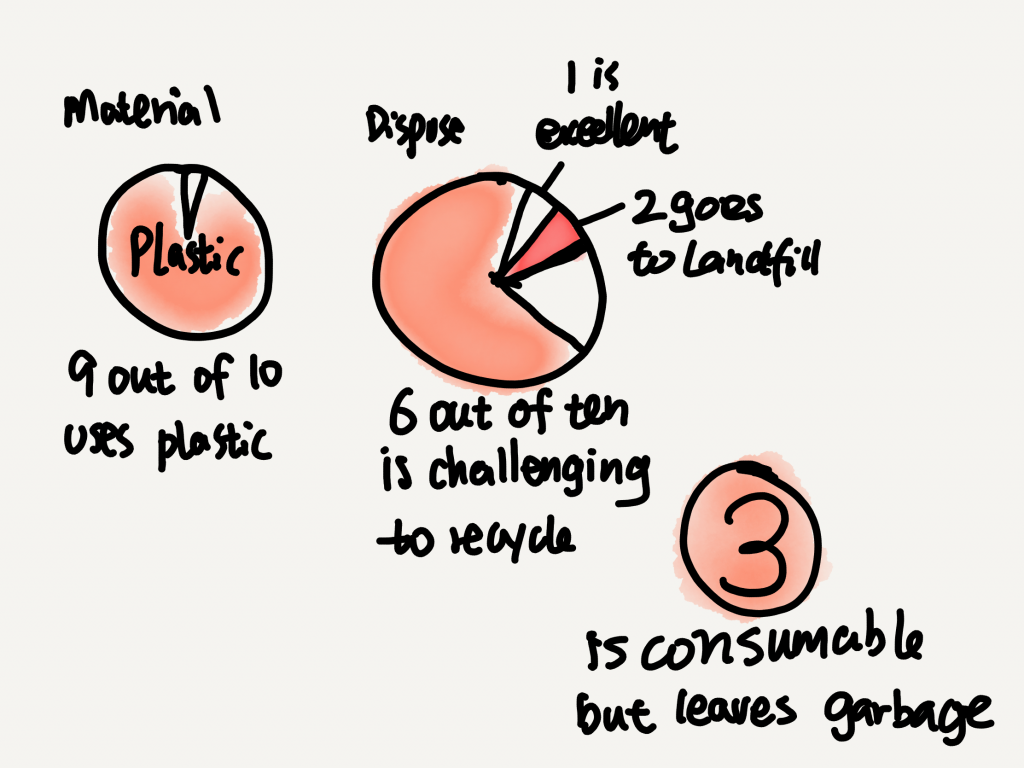
I then made sketches on how these data could be analyzed and visualized. The first diagram shows out of these ten objects, how many contains plastic, and how can they be disposed. It informs me that these frequently used objects are not the best choice for the environment. But at the time of purchase, considering its other properties, like functionality, price, and convenience, it might had been the best option for my need. The fact that my analysis of their “environmental data” makes me question my first choice is quite inspiring: At the time of purchase, somehow I tucked the consideration for the environment, as well as the work of analyzing their impact to the back of my head, and prioritized my need for their functions at the moment. In retrospective, after investing some time into knowing its impact, I realized that there were better options than buying those products, and it is something I would consider next time before making decisions. If this assessment process happens before every decision, the objects around me will be much friendlier to the environment.