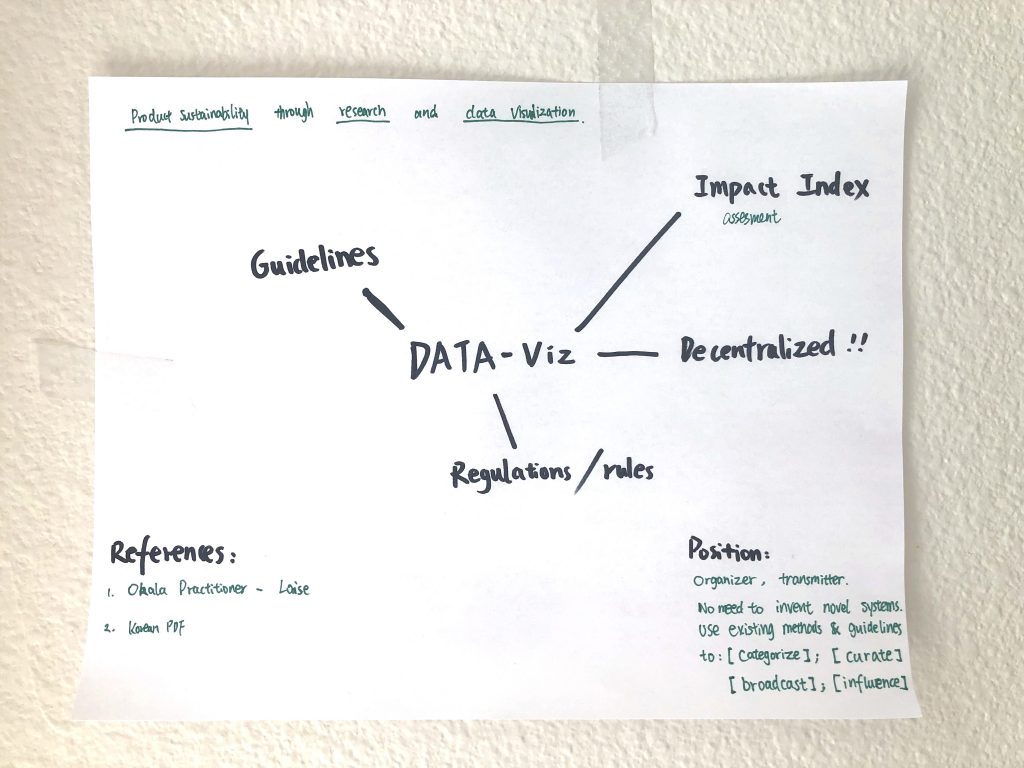
Before I had any solid ideas, I made a goal for this action:
“Investigate product sustainability through actions of research and data visualization“. In Action 5, a great discussion came up when presenting my second video sketch: How do we know for sure that one product is sustainable, that is from its source to the market? It would be generalizing if we just make difference between one type of product like a plastic bottled water to another, such as seasonal produces. There has to be more intensive searches into that product on its own, presenting specific information exclusive to that particular type of apple, grown in that particular piece of land. This realization is made me choose such topic because I want to explore ways to monitor product sustainability that are democratic instead centralized.
One method that came across my mind was data visualization. Since data can be gathered from a crowd-based manner, it might opens door to an ideal situation where everyone voluntarily contributes their data to monitoring the sustainability of a product. However, I did not have any prior experience in working with data, collecting or presenting. To not make this action just about learning skills, besides starting to learn the programming language Python and read books about data visualization, I started my action by drawing out clues and parts that I can work on, since the topic is very broad.
I decided that the subsequent actions in this term will be mostly focused on this topic, so I took it apart to multiple directions in the pictures below. There are several criteria to consider when evaluating the sustainability of a product, and for this action, I chose to examine the skin of products – the colors in packaging.
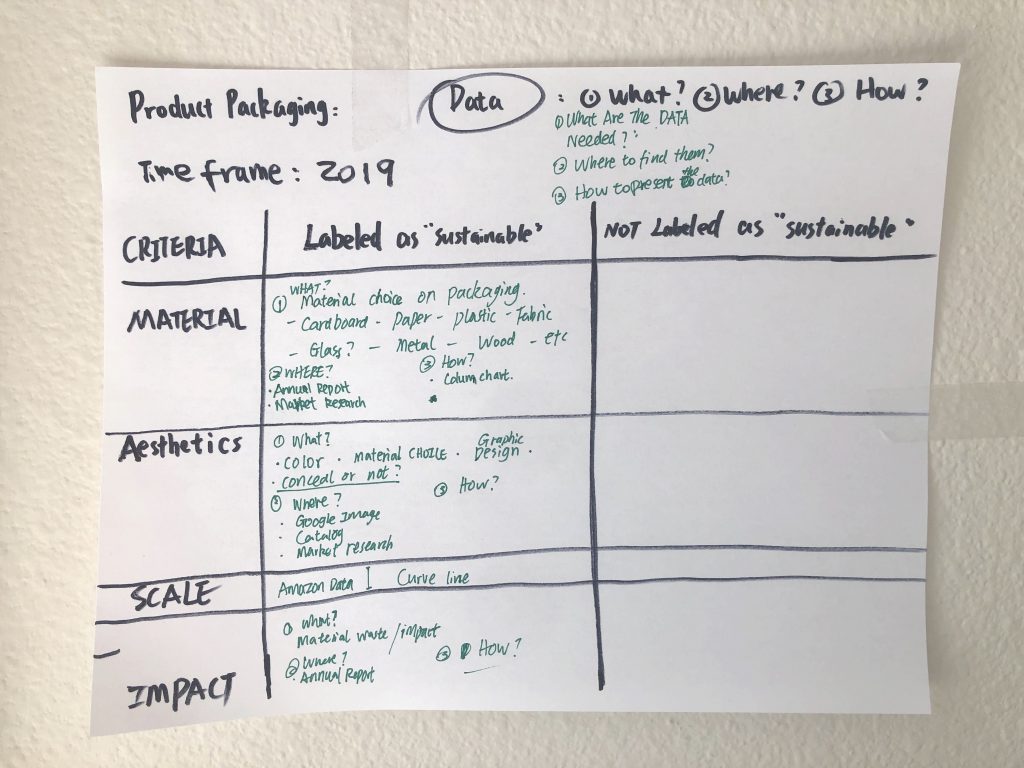
A question was in my mind for a long time: Does Sustainability often presented with certain aesthetics? The choice of color seems to be a prominent consideration when designing packages for a product. To explore more, I also downloaded many annual business reports from big companies like Coca-Cola, and also from the companies that claim to make eco-friendly products, like Ecoproduct. I went to evaluate the percentage of “sustainability” played in those reports, manually logging the colors that are used in the in the sections related sustainability, as well as the page number data (how many pages in a report were about sustainability).
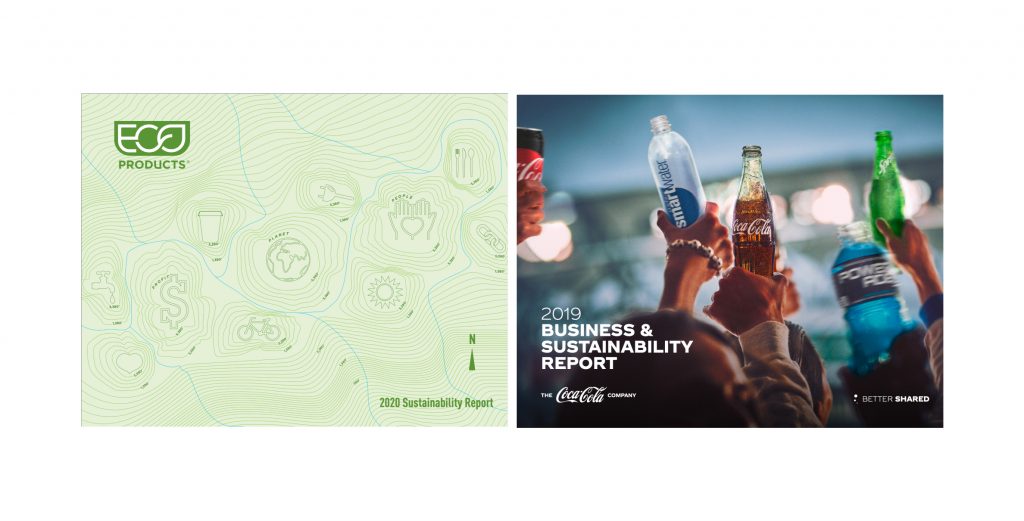
The covers for Ecoproducts & Coca-Cola’s annual report 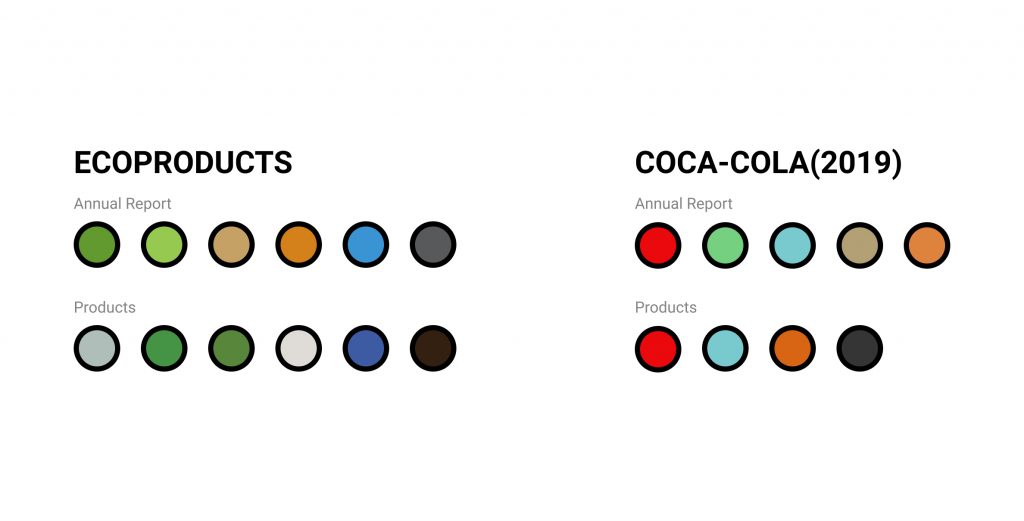
Color palettes extracted from annual reports and packages
During this part of annually logging, I found 3 things very difficult:
- Efficient collection of data
- Summarize and present color
- Doing all the above objectively
Moreover, the data gathered can be really confined due to the corporate presentation manner.
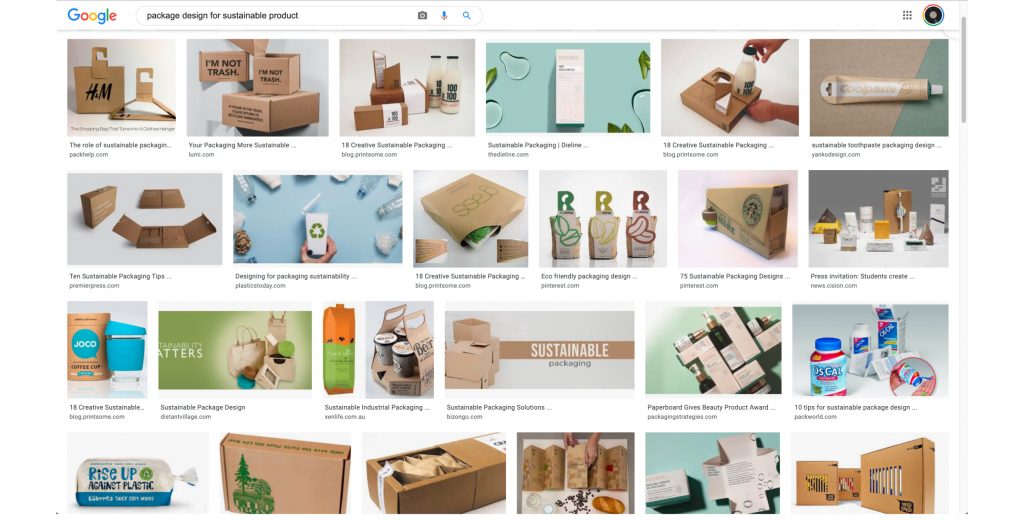
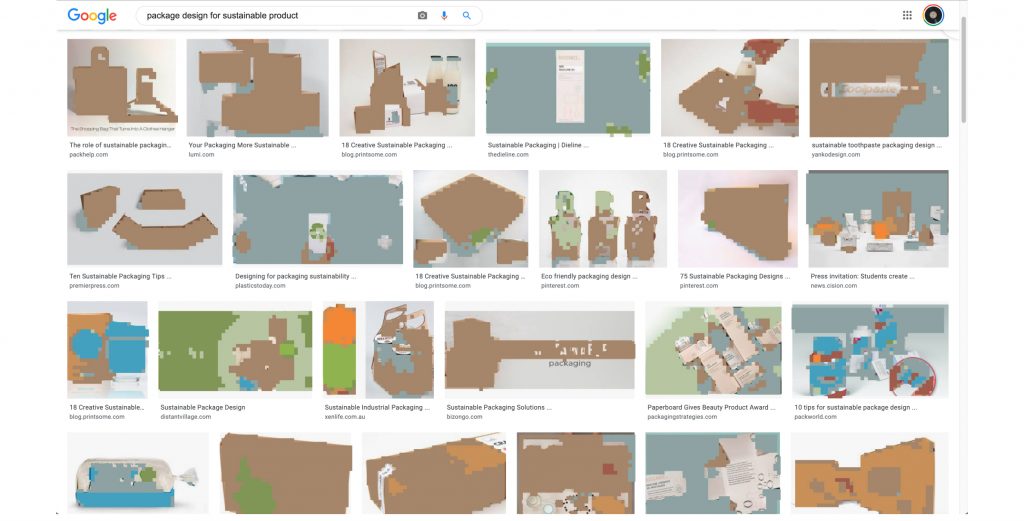
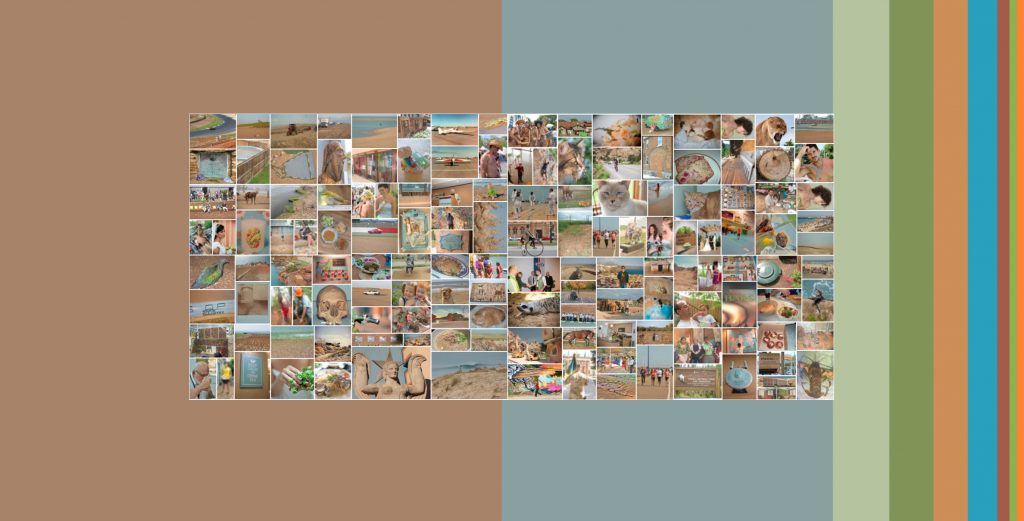
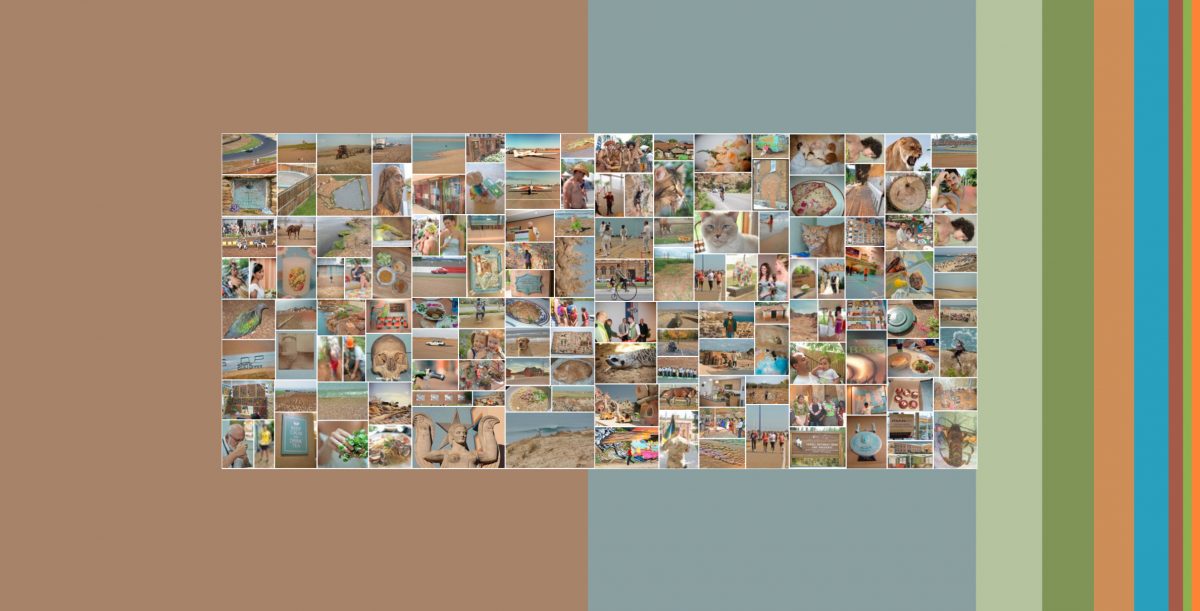
I then expanded the color research into a more broad scope of products. I searched for images of sustainable product packagings, and collected their color individually. From all the results I put together a color palette of 9. These colors were taken into a reverse search because I wanted to see what those color stand for in the real life. Turns out its mostly desert, sky, water body, skin, food, and pants. How are the packaging and these subjects are related?
Overall, I was surprised by the amount of data that I had to collect. I was puzzled by the extraction of data from these reports. It was really tricky. How should I do it? Next step I am going to learn to use Python to solve this puzzle.