 Alonso Molina Adame
Human-built public ways on land, are meant to connect cities and places within them. There are different variations, and they can prioritize or exclusively connect people through a single mobility idea. Highways and streets prioritize cars. Tracks and railways exclusively accommodate trains or subway systems.
After the Second Industrial revolution, these connections became commonly car-centric. Paved strips in the land create barriers and separation, thus becoming an issue for wildlife and their habitat.
A way to minimize the side effects it has on wildlife and their habitats; people have been building wildlife crossing structures. In the most northern climates, the structures in the form of overpasses — above highways — or underpasses are the most common. These connections between wildlife habitats have created safer highways for humans and increased the amount of wildlife in the near habitats (Parks Canada, 2007).
E.O. Wilson wrote in The Diversity of Life about the importance of biodiversity, he then argued that the worst contributor to current species extinction is habitat destruction. (1992). A way to offset this problem is by reconnecting the wildlife habitats which will promote and increase biodiversity.
The biodiversity theory is backed up by experiments such as the island bird data and Wilson’s and MacArthur’s theory of the island biogeography, which usually is used to explain the number of different species — or patterns of species richness — on islands (1960).
As Triantis and Matthews explain, there are two main patterns. One is that species richness increases if a greater area is sampled. The other pattern is that species richness decreases the more isolated the island is — the farther away from a potential source of species, such as the closest mainland. (2020).
Striving for symbiosis and balance in order to coexist with nature, connecting greenspaces not only achieves exchange and communication within communities of species, but also actively creates public space throughout the cities implemented.
Human settlements like cities can be thought as human habitats, built by and for themselves. Inside the cities people need to connect and travel, thus creating different transport connections usually made from pavement and concrete alienating other forms of life. The preservation of these other life forms is very important for the survival of human being, thus creating pockets within the cities referred as greenspaces.
The health benefits of greenspaces are vast, but they are also required for social connectivity. (Holland, 2020).
The greenspace connections project not only would create access for virtually any point in the city to a greenspace and other public spaces, but also an efficient and secure way for pedestrians to travel more quickly, making spaces for communities to engage and socialize.
A greenspace connection system such as these ones, thought as a lives first connectivity system, will also facilitate successful connections for the communities of wildlife and other species, which biodiversity relies on.
Just like the wildlife counterparts in Banff National Park, other types of living beings would have a larger space to satisfy their needs. The biodiversity of the urban landscape and its surrounding could grow exponentially.
This is an update on the last post. I am creating more maps based on the last one. I also separated the layers of the different “instant” visual information within the map itself.
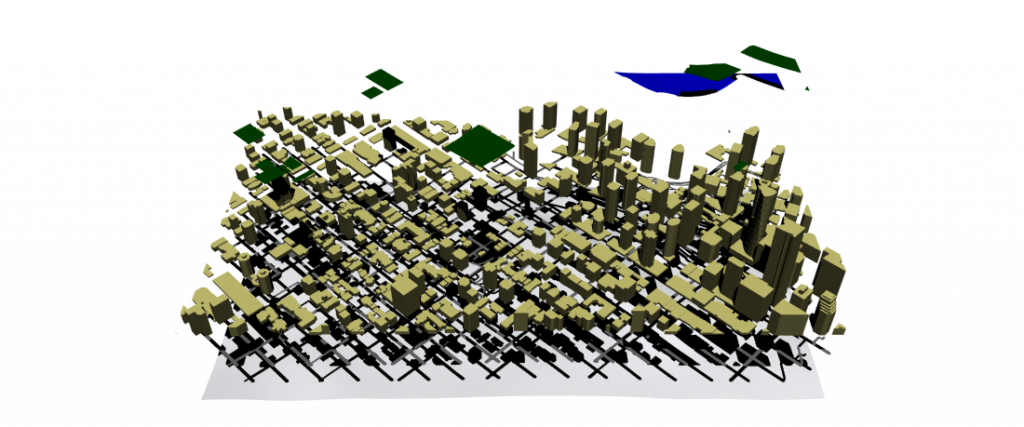
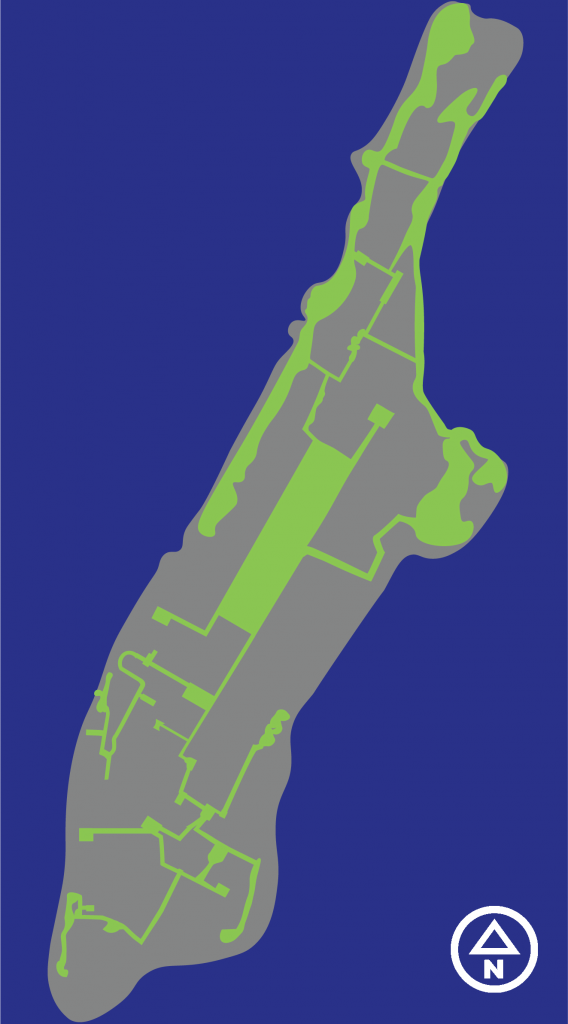
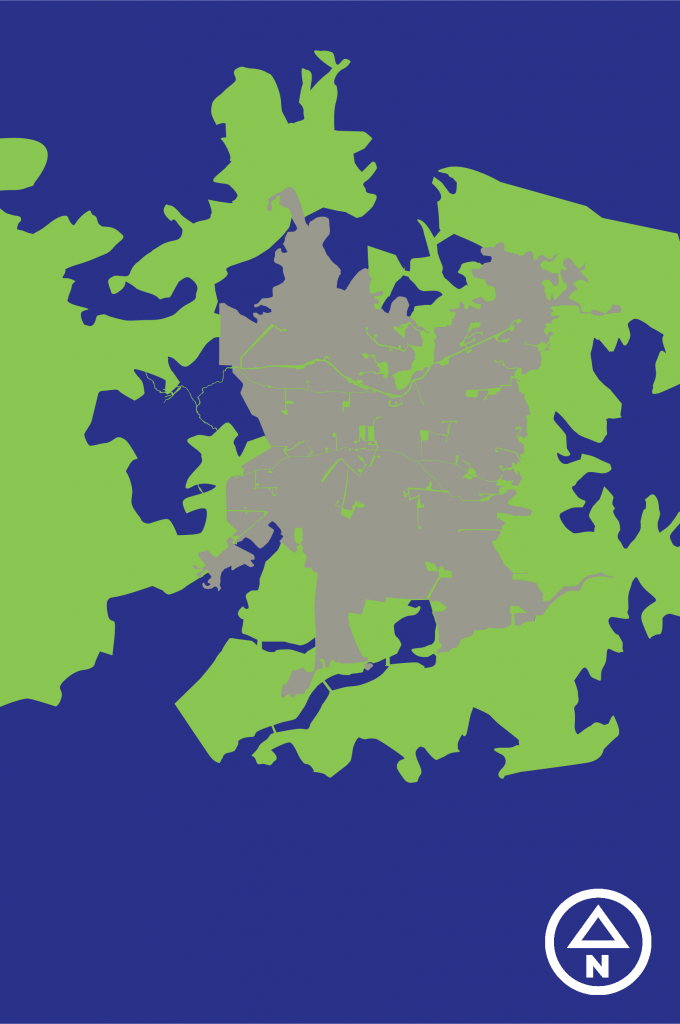
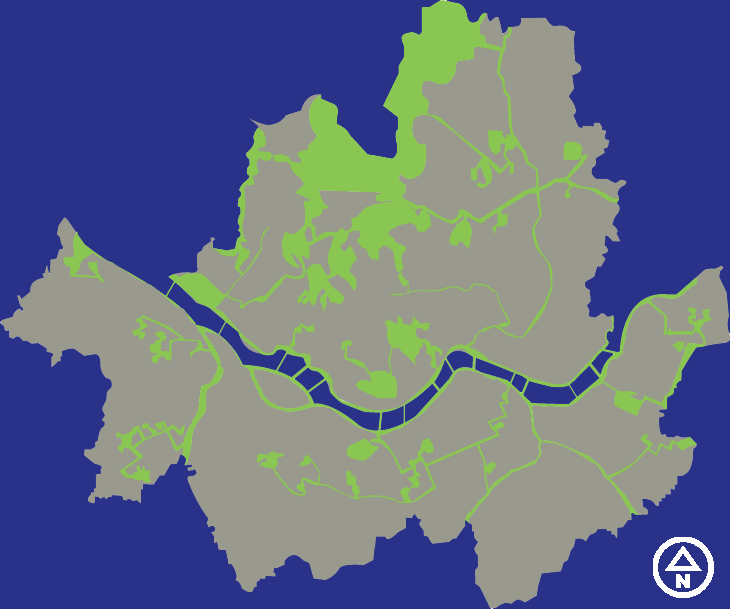
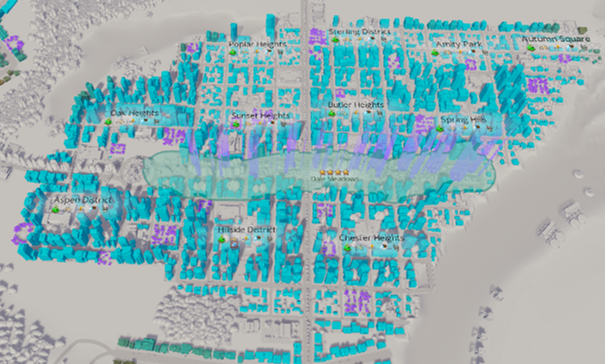
The map size is 1km square or 1’000,000 meters squared.
Maps are conveyors of information. Vessels of knowledge and thoughts. These were statements that came to my mind while doing the last few explorations.
This is why I decided to create maps as a way to inform the results of my research. This has proven no easy task. Although the most common map for me, is one that can have different layers of information, I found it to be too logical. This type of map did not allow nor invite to reflection. The information that it has, is what you get.
As I mentioned on the previous exploration, I wanted to create maps of cities that could inform designers where are the opportunities for urban design improvement. But how to do this without an authoritative voice. This research can’t be a perfect solution, nor an omnipotent strategy. As this will cripple one of its basis: speculative design and its inherently challenge to the status quo.
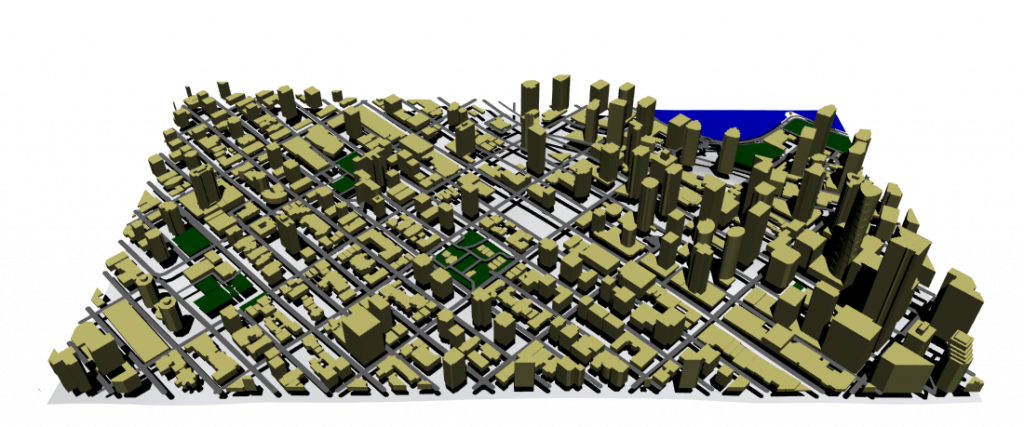
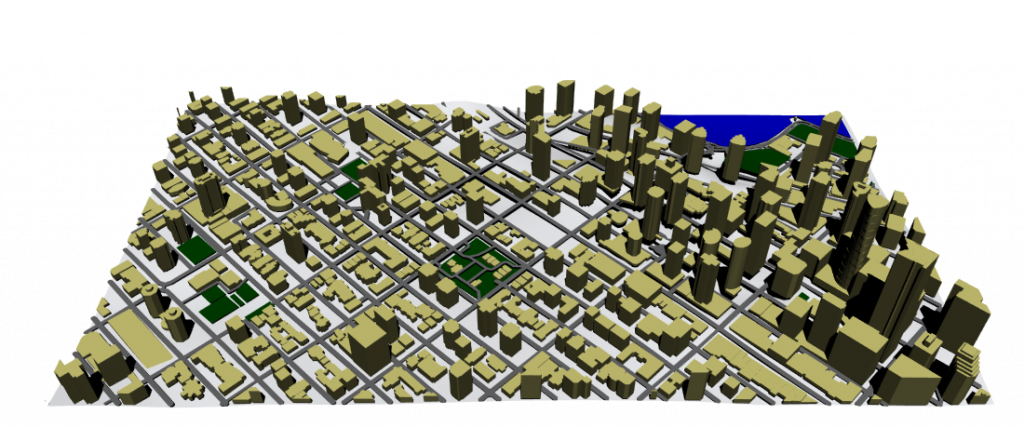
This 1 km2 map shows a walkable distance of around 15 minutes. We can see that the denser the area the sporadic green spaces are fewer and larger central ones are accommodated. But this map does not invite for a more reflexive read.
I’ve been taking the concept of mapping in a very “modern” way, where its purpose is to “geolocate” and advertise “what is around”. I think I have to look further into other types of mapping. I need another perspective.
It was a Thursday around ten at night, and the next day I needed to show and explain advancements in my research. By this time I already had a presentation, but I felt it didn’t quite explain all the work or mind processes that I’ve been doing or were in my head.
So, I decided to create a Fantasy City, a one place-discussion focus that could showcase of all the relevant subjects and explorations I was working with.
In this case I decided to use the city-building simulation game Cities: Skylines. This allowed me to access thousands of resources and mods from the player community, and I was able to depict my explorations very quickly.
I took every insight I had and somewhat plug it in. Some of them I haven’t made an exploration, like Small Green Space. I used the Grid exploration to allocate services and needs. I used the New Broadway exploration for the roads of the city, giving me a unique view of a city with a less car-centric street approach.
But the most interesting thing about using this platform, was the various map views that gave me with information needed, in order to achieve the many goals the game has.
This inspired me to create the current exploration I am working on: maps of cities that can inform designers where are the opportunities for urban design improvement.
Exploration in progress, soon to be uploaded.
In order to get better understanding while doing my explorations, I decided to relate them to the city which I am a resident from: Vancouver.
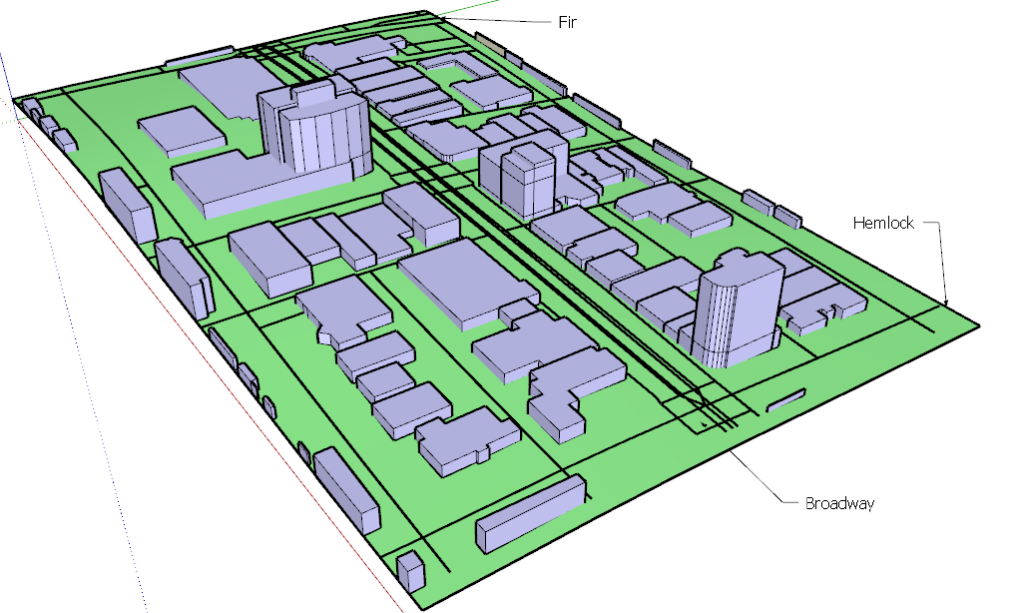
It is not a surprise that most North American city’s after the Second Industrial Revolution were modeled or adapted a more car-centric urbanism. I took Broadway as an example for this exploration.
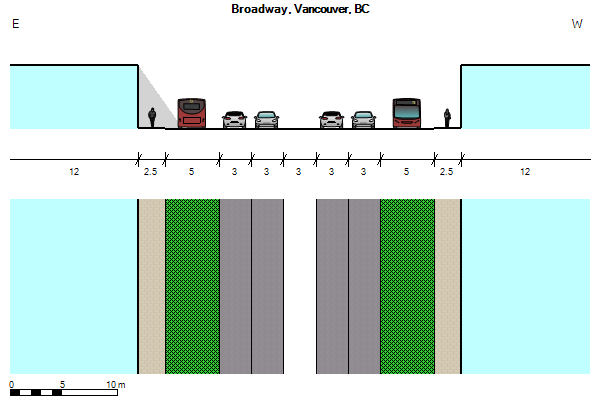
This is a model of Broadway as it is now, with exclusive bus lanes and 4 car lanes. In the center there is another lane that serves as a left turn lane in pertinent crossings, but is removed mid block to give space for parking.
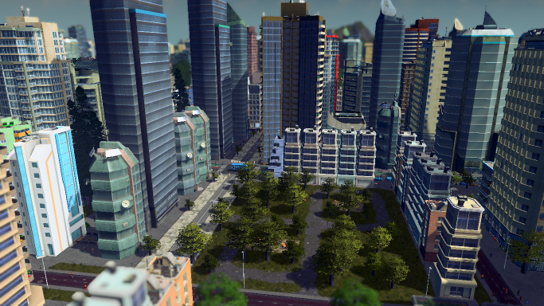
I wanted to see if with a less car-centric view I could accommodate the same traffic lanes and add space to other forms of transportation.
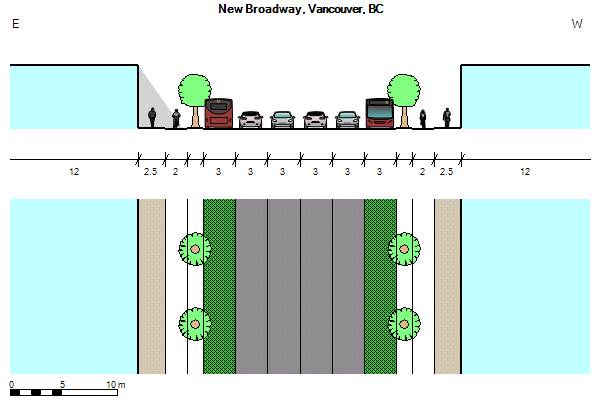
So, just by removing the flex space contemplated for parking/left turn lanes, it could be possible to add dedicated bike lanes protected with median strips lined with trees.
This simple exercise made me realized how much space in roads is contemplated or reserved for possible car usage.
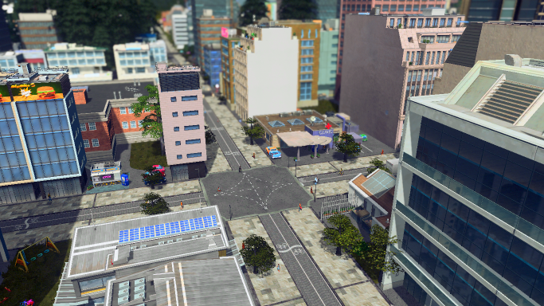
I decided to take a width of a small residential street, which usually has little traffic and thoroughly transforming it into a pedestrian-centric road.
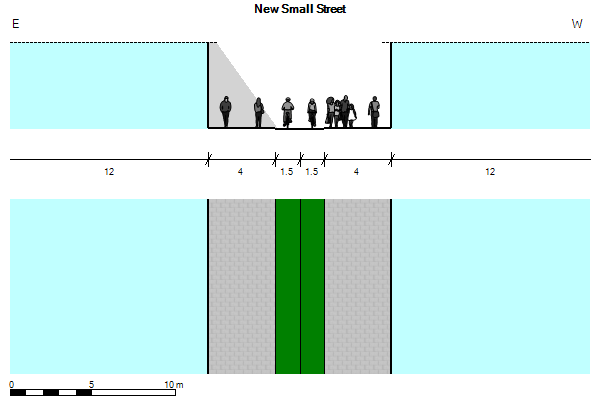
In this case I widened the sidewalks to allow more space for pedestrians, dispersing crowds an important trait in a socially distancing world. Local traffic or emergency/service vehicles could take up the bike lanes in case its needed.
One of the explorations that I made, as I wanted to dig deeper in some of the insights from the summer research, was to create a grid pattern of blocks. Then, as an added layer, I created a pattern of circles, representing 1.5 km radius ̶ which is a 15-minute walk ̶ and 3 km radius or a 15-minute bike ride.
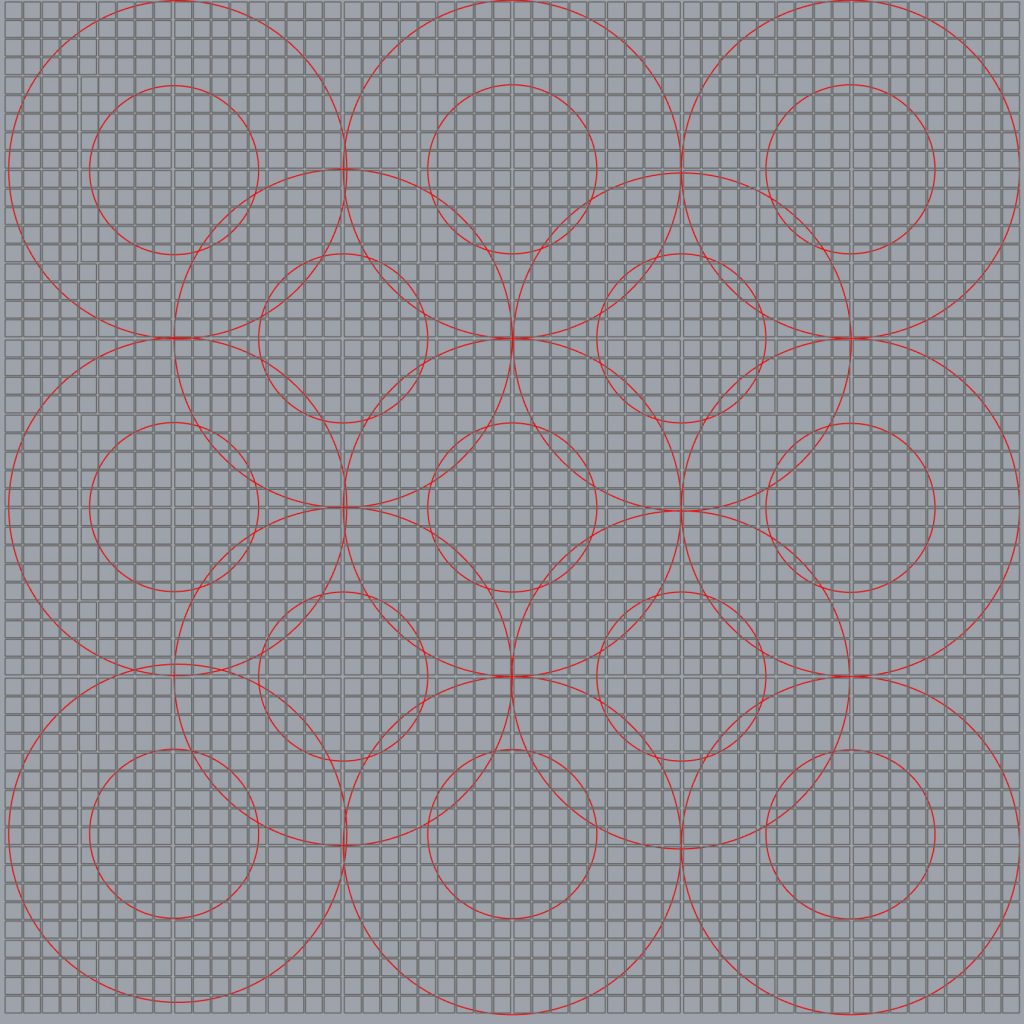
This simple grid represents a rather large city of 324 km2 ̶ around the size of Philadelphia ̶ . If we wanted to create a multi-center city, in this grid that would mean at least around 13 centers that could provide with all the services needed. This exploration of course does not take density into consideration, just area.
This would mean that a city like Vancouver (114.97 km2) would only require a minimum of 4 to 5 centers. In contrast, Vancouver is divided in 23 official neighbourhoods, a way to break up the city’s geographic area for delivering services and resources.
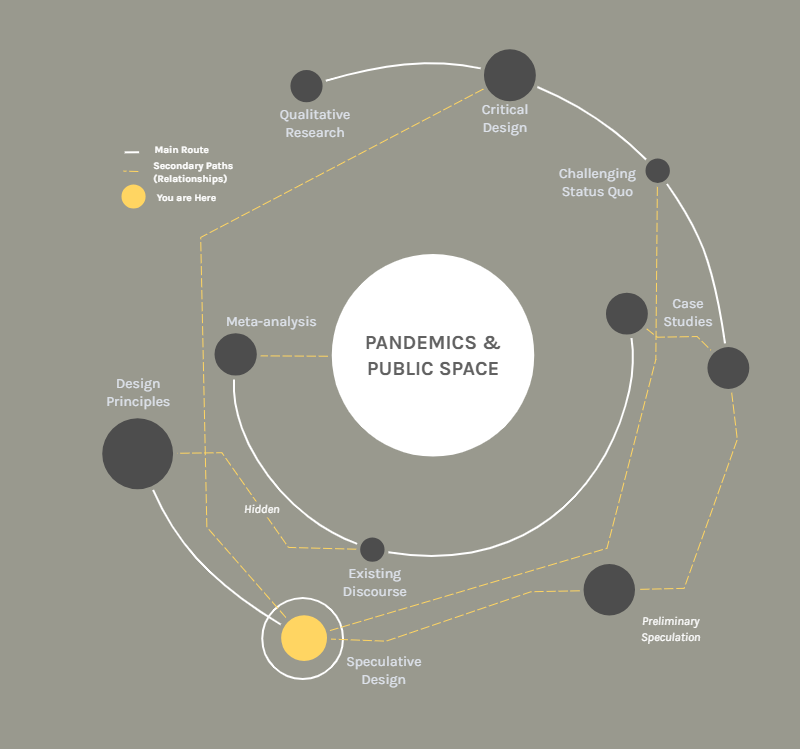
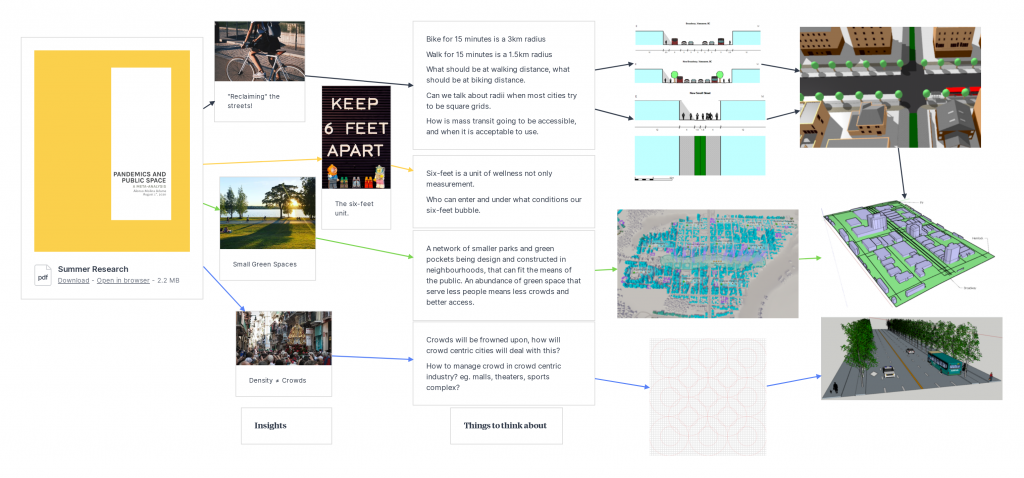
This map shows the direction of the research. Using the summer document as a starting point, and applying the four main insights into different explorations. The map is continuously updated as work and research evolves.
The insights explored are the following:
For this summer I decided to do a non-practice-based research in public space.
The goal of this research was to understand the close relationship between public space, epidemics and the public’s behaviour by doing a meta-analysis on existing discourse and conducting case studies.