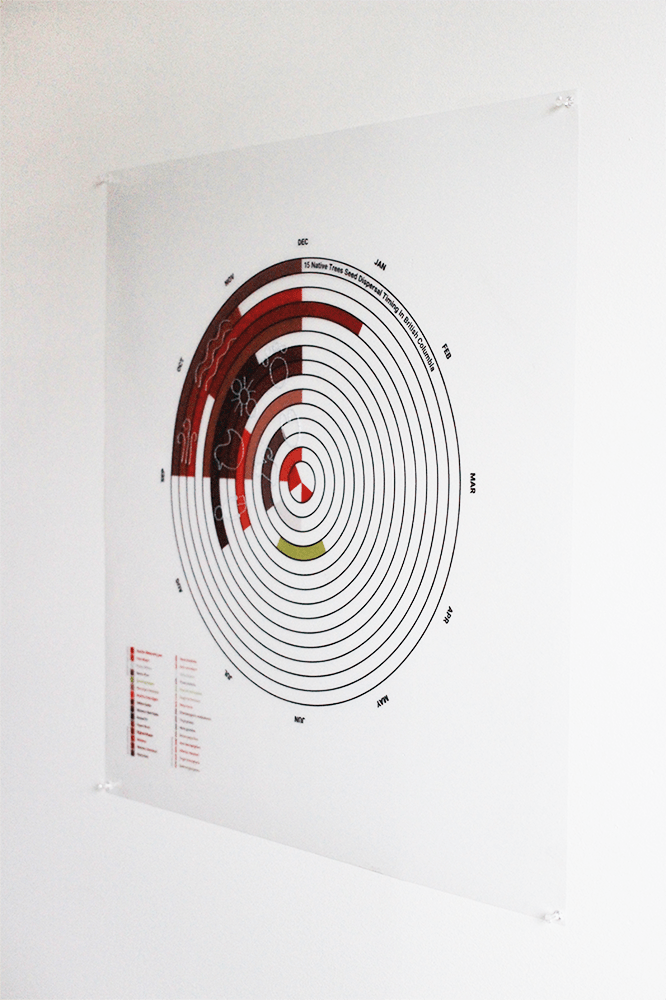
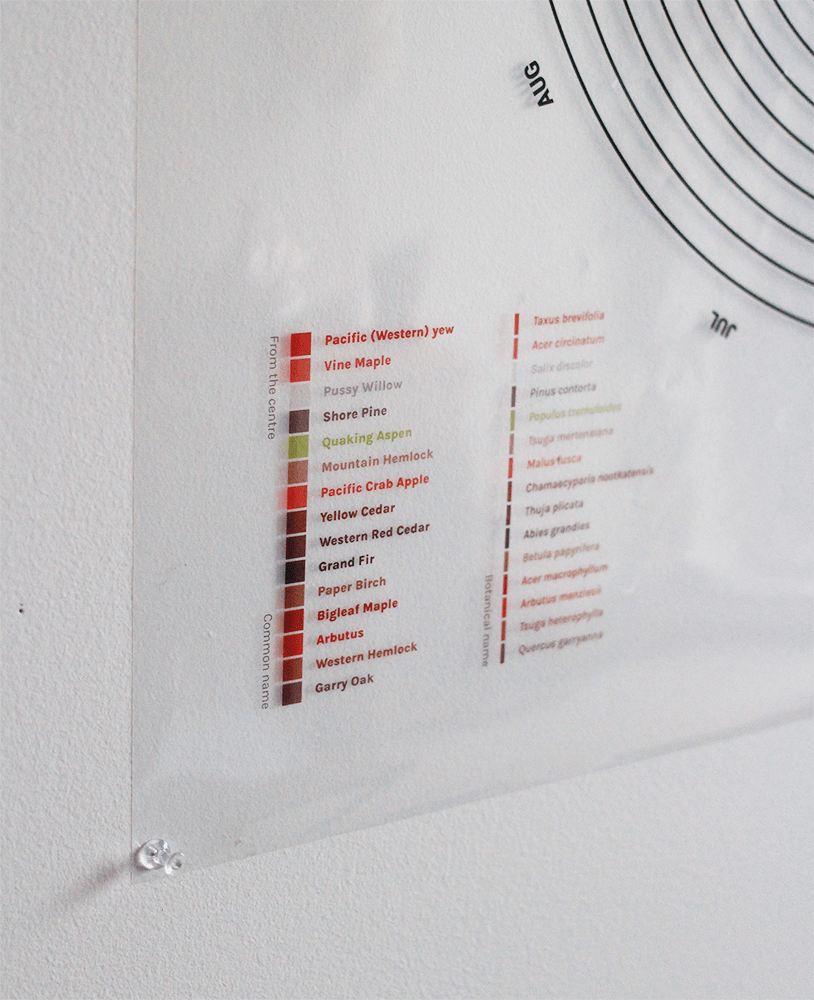
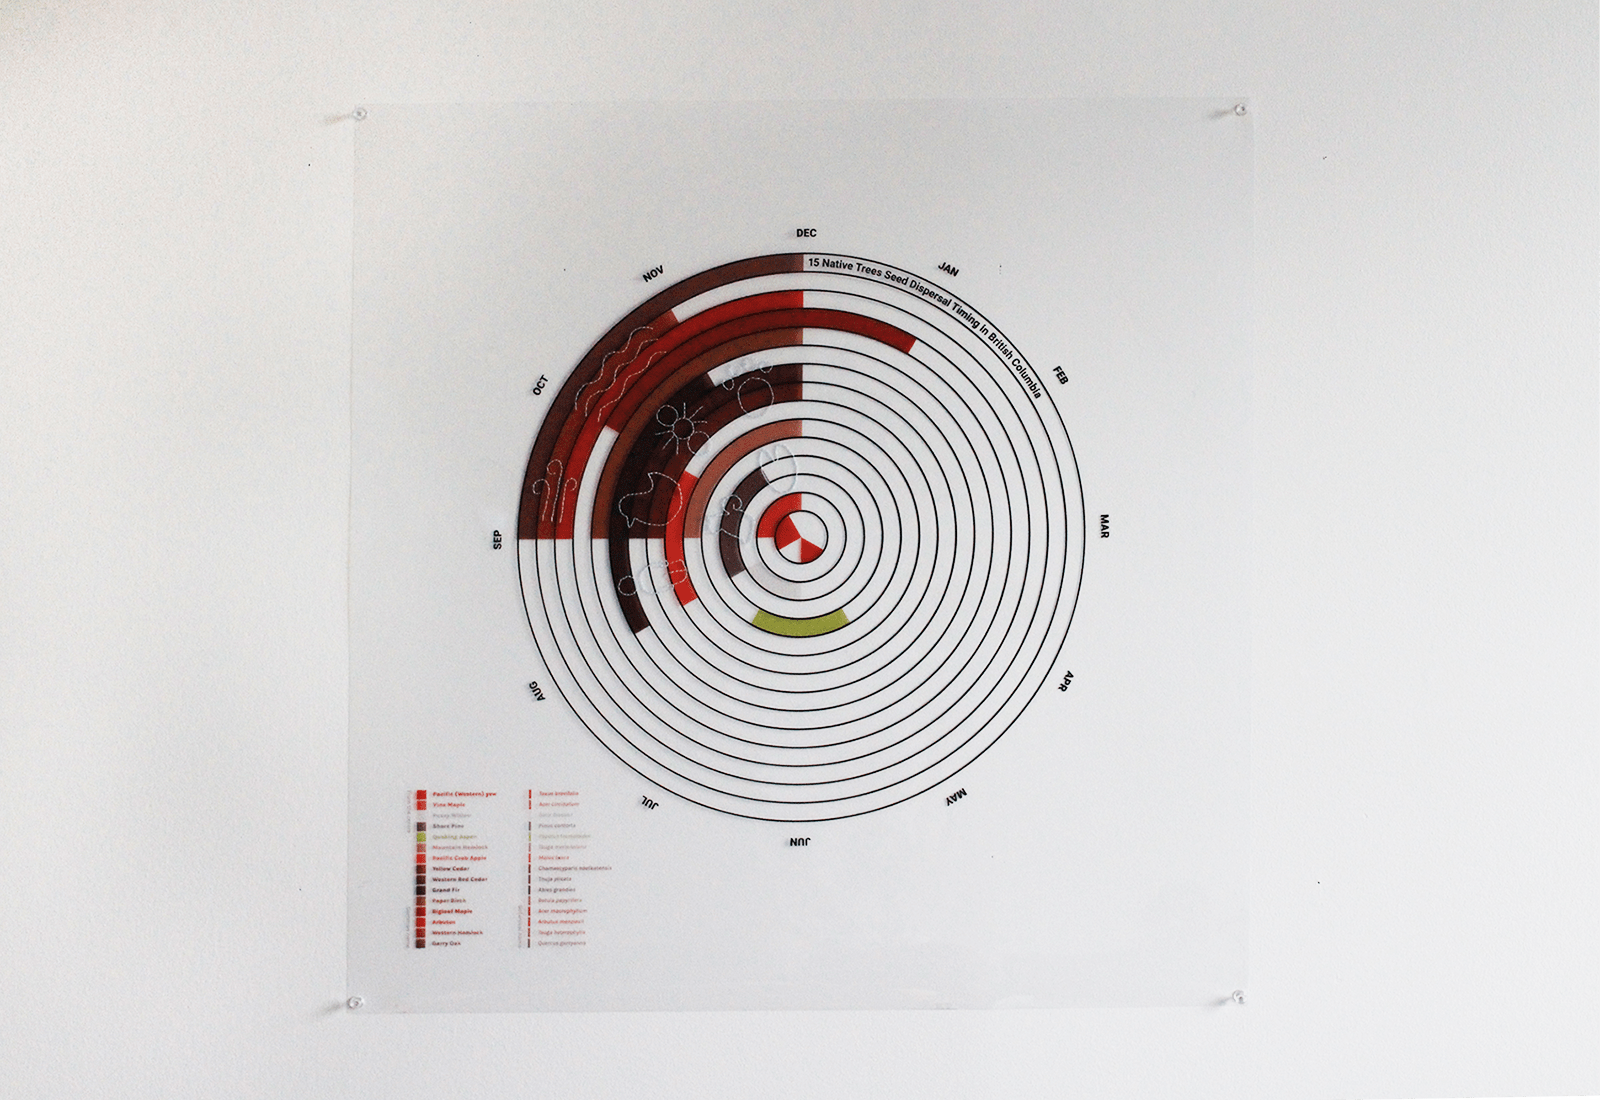
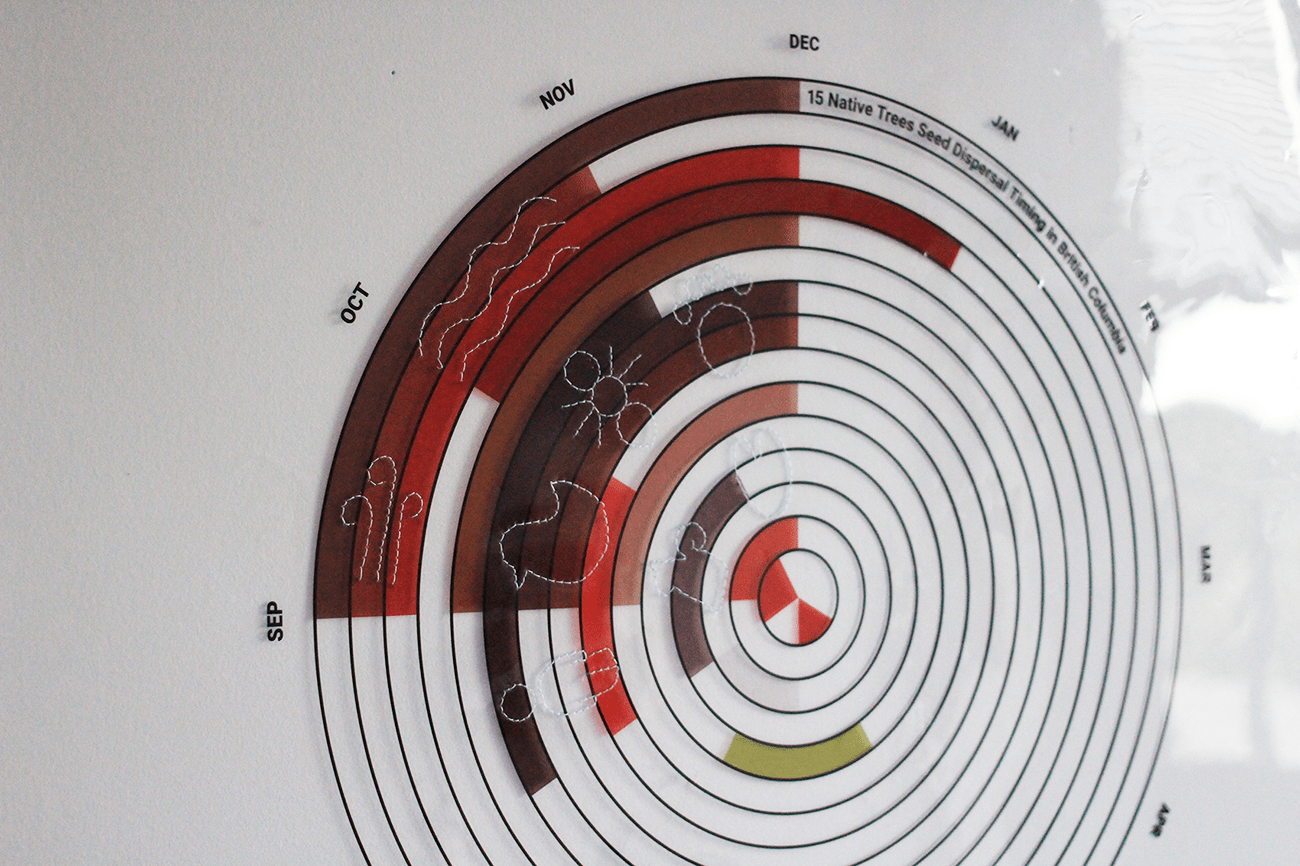
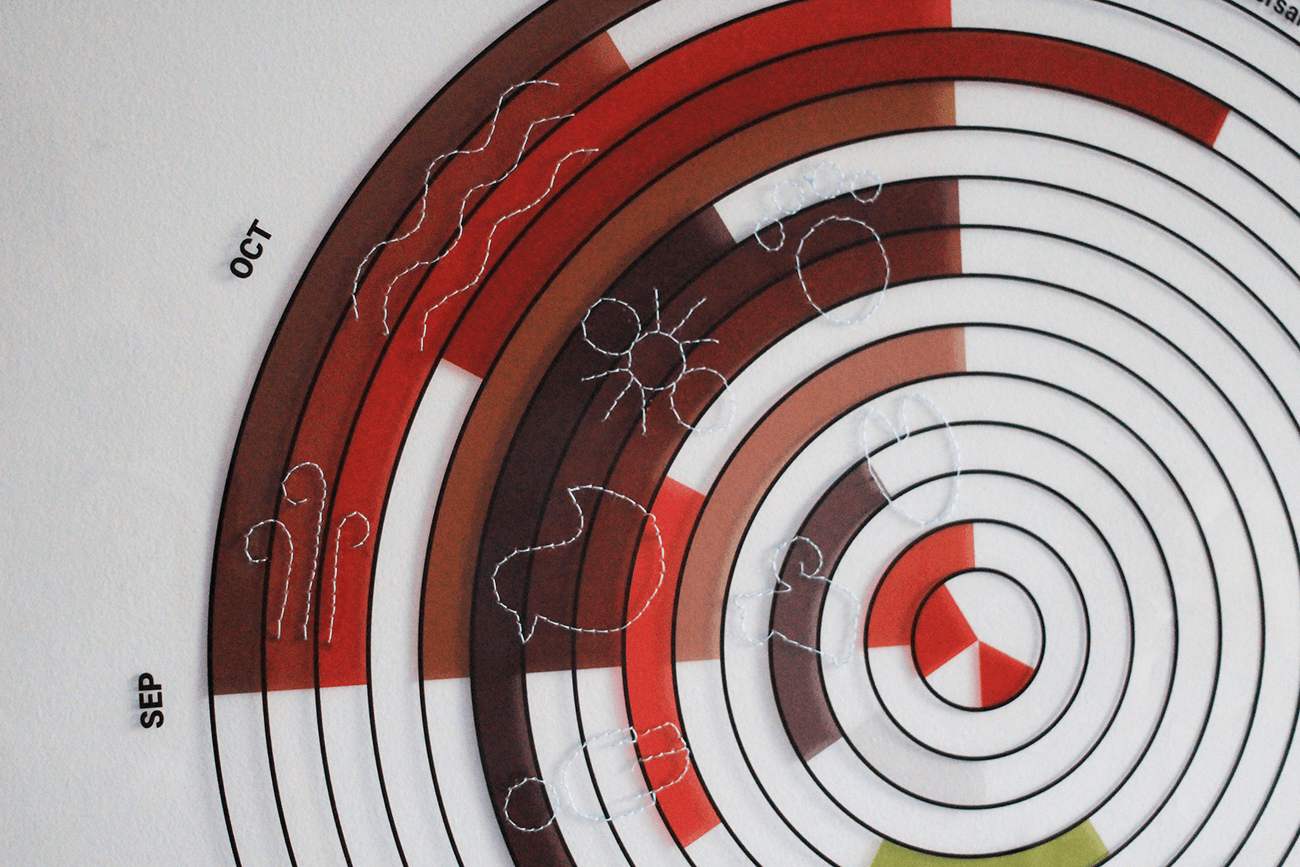
Seed dispersal timing and agents of 15 native trees in BC
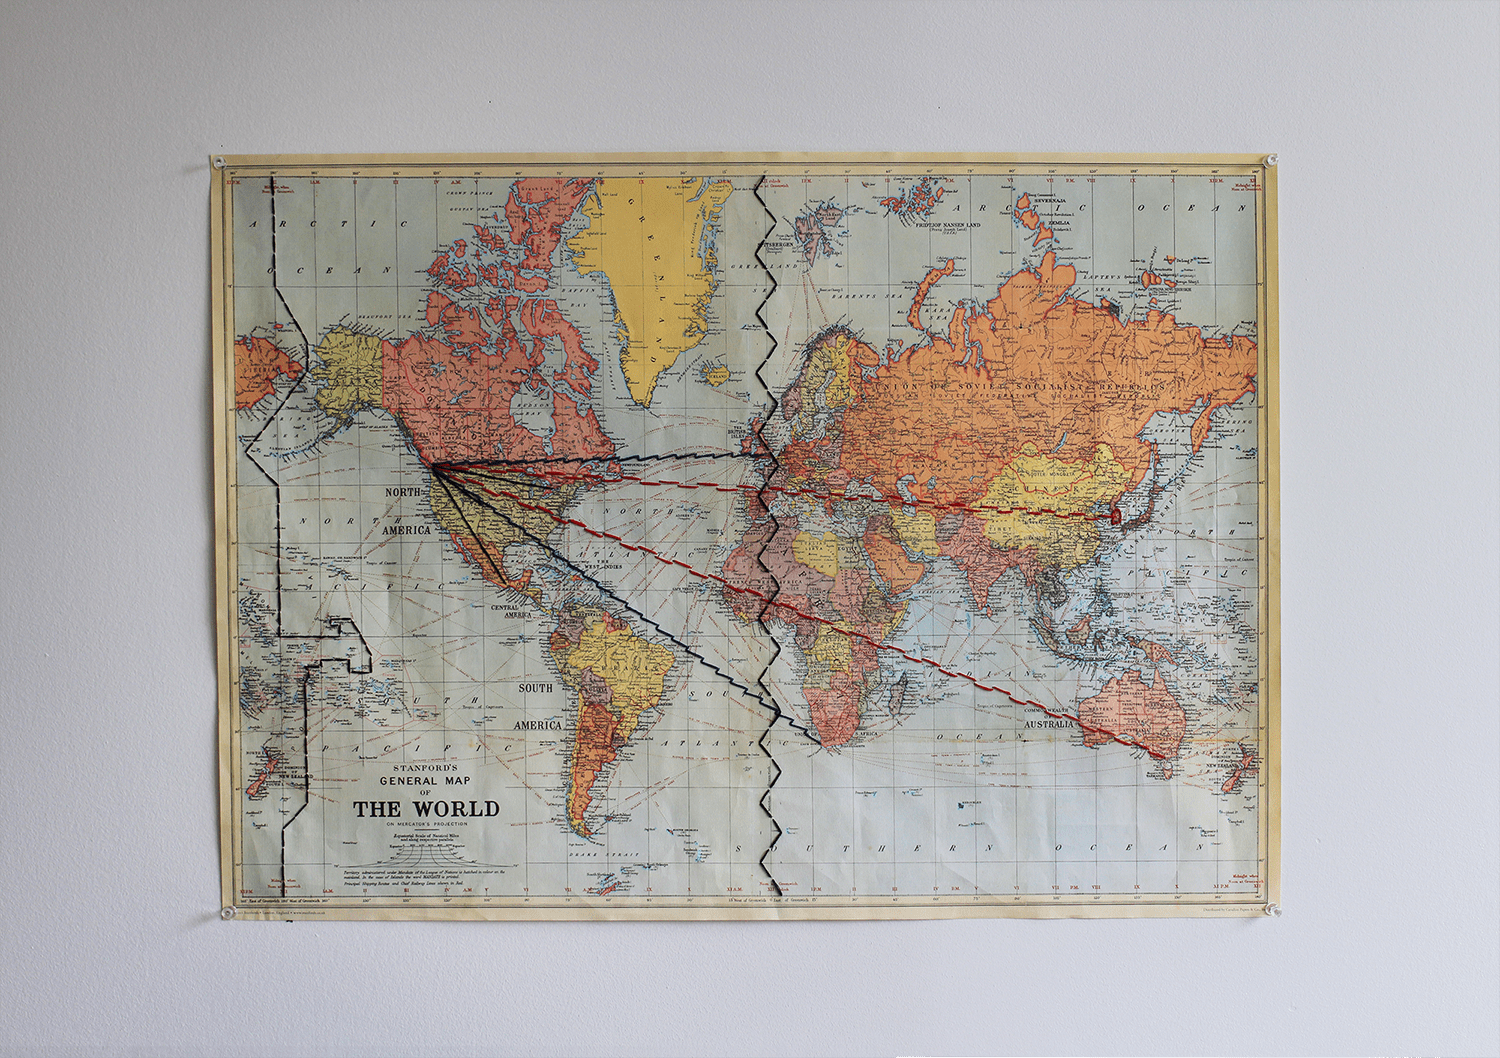
I was first introduced to Natalie Jeremijenko’s Phenological clock work by my supervisor last year. Natalie is an environmental artist and engineer. She, Jake Richardson and Blacki Migliozzi created a beautiful data visualization tool that displays local flora and fauna timings on a Jan through December clock face. These seasonal events captured on the clock show connections and dependencies of flowers, insects, butterflies, bees, birds and trees in the perpetuating annual cycle from the innermost to the outermost rings. My supervisor and I wanted to bring this beautiful work back to life at Emily Carr so that everyone can collectively record numerous ecosystems that invisibly surround us.
While discussing the logistics and challenges of the work, I wanted to make an analogue example of the phenological clock to understand the design and the process of rebuilding this platform. I began to desk-research seed dispersal timings for 15 different native trees.
Data visualization and infographic
Attempting to create a native tree’s seed dispersal clock based on other researchers’ work, I wanted to understand what it means to put this work out in the world again, imagine what it can do, and how I’d visualize and communicate this data example.
Since I decided to continue my study after industry experience, I couldn’t stop thinking about the possibility of my role outside the commercial realm. Graphic design is one of the most influential and strongest communication tools to disseminate information and diverse messages. After practicing this daily at work, I almost automatically use relevant skills to make the information digestible and “aesthetic.” However, thinking about the role of graphic design in sustainable everyday living, environmental conservation, and consumerism, I sometimes couldn’t help but feel skeptical and inadequate about my skills and strengths. Especially interacting with people making practical, social, and direct changes in people’s relationships with nature made me question whether the urgent work we collectively need to do as humans even needs graphic designers. A series of questions and doubts arising from reflecting on my practice and others’ help me ponder other ways I could expand my work. Could displaying, showcasing, and materializing significant but invisible time through ecological perspectives support and empower individuals’ daily decision-making with sustainability in mind?
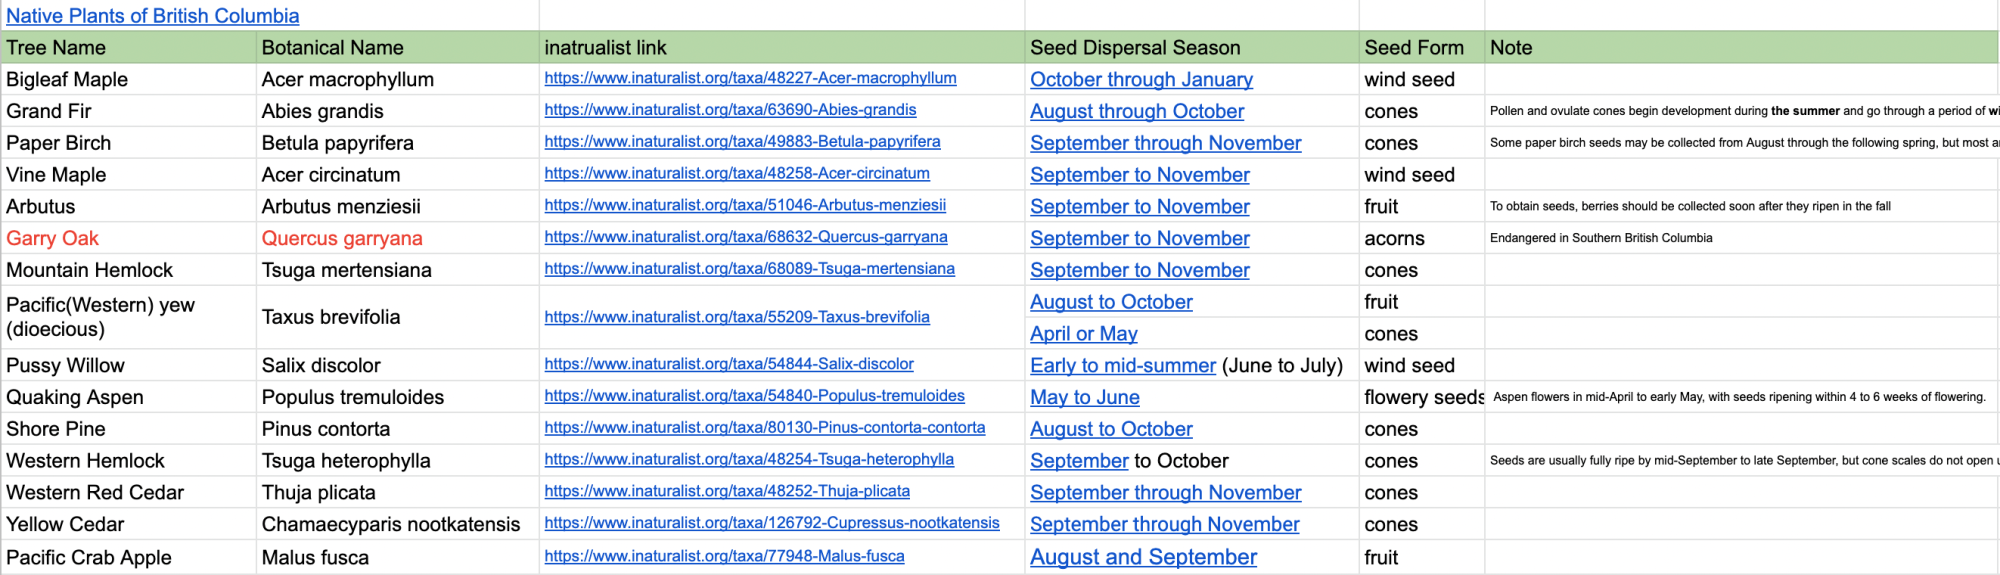
While researching information to collect seed dispersal timings for the clock, I was slowly able to grasp some trees’ common reproductive features and seasonal cycles that I was unaware of. I also realized how each seed forms differently to be carried away by humans and non-humans and how accessible and open the related knowledge is through government and citizen-led science websites.
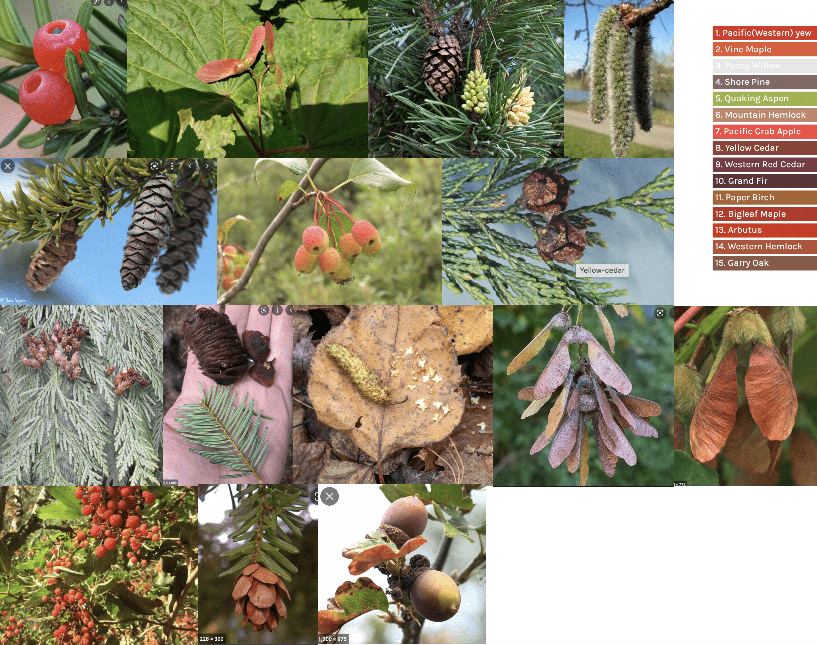
While desk-researching reproduction features and timings of 15 native trees in BC, I could recognize some of the seeds from the pictures. I was living in a house with a patio last fall. After rainy, windy days, little seeds often covered house entrances and the shoe rack. (I think they were Paper Birch tree seeds) I was curious about what they were but never knew that they were tree seeds carried by wind, rain and sometimes my housemates. After gaining this little amount of knowledge, I noticed I look at the ground more when I walk, trying to find seeds that I might recognize and see whether I can find the mothers that produced the seeds. I found myself interacting with city trees more consciously just because now I know some of their names, leaves, and seeds.
How can I visualize and communicate this experience with trees beyond the data? What do I want the audience to experience while looking at this information?
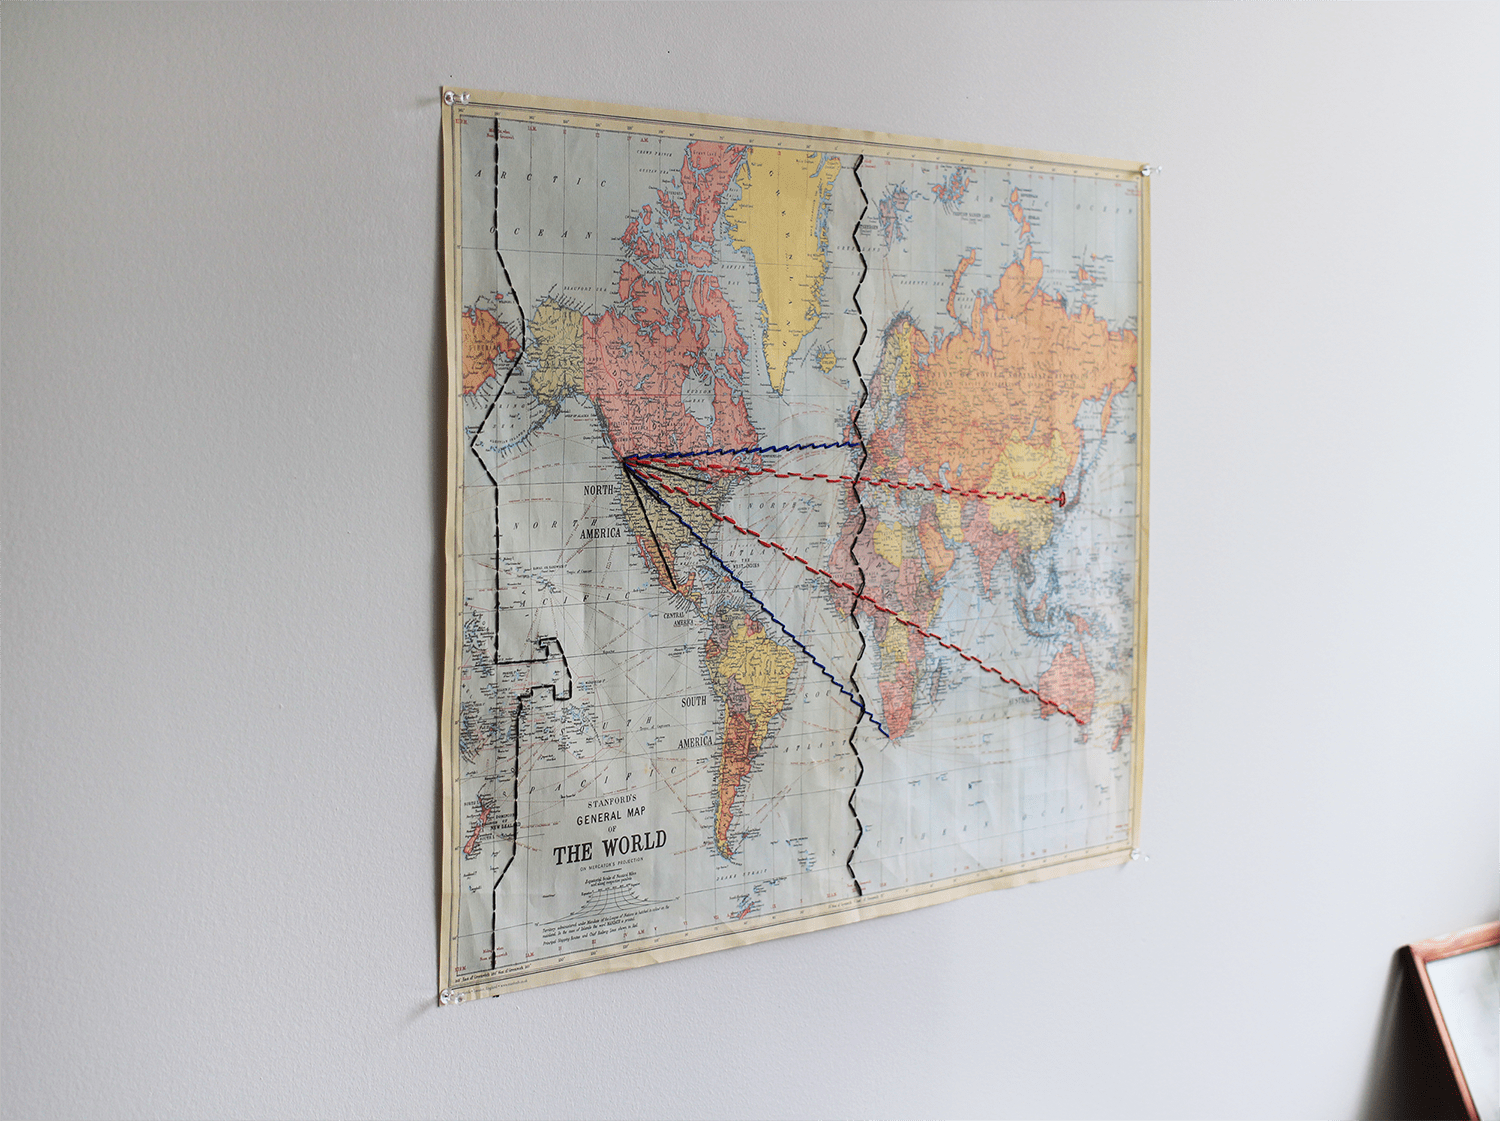
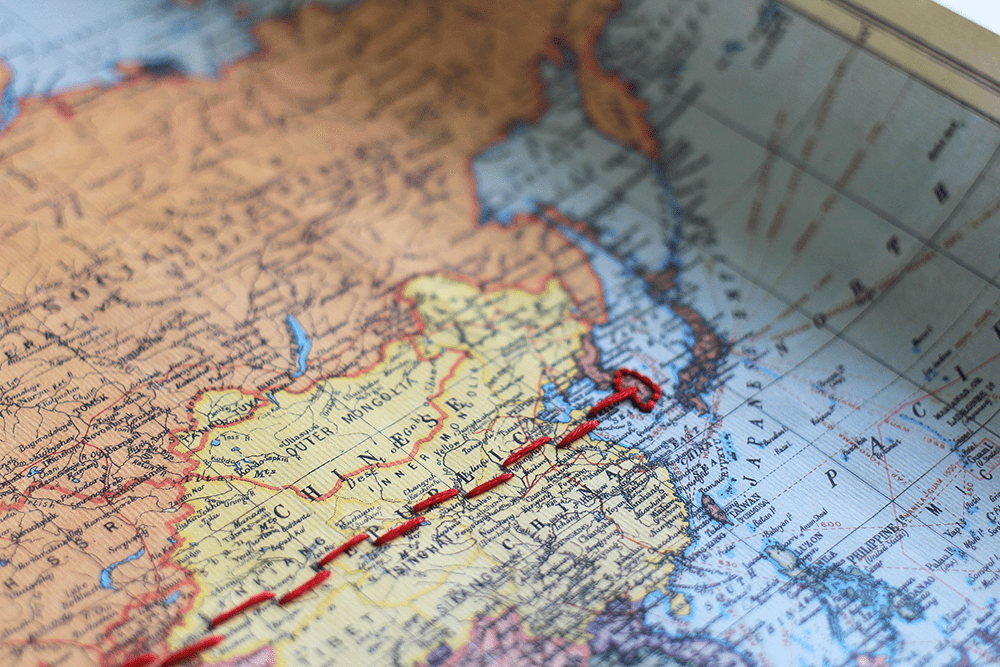
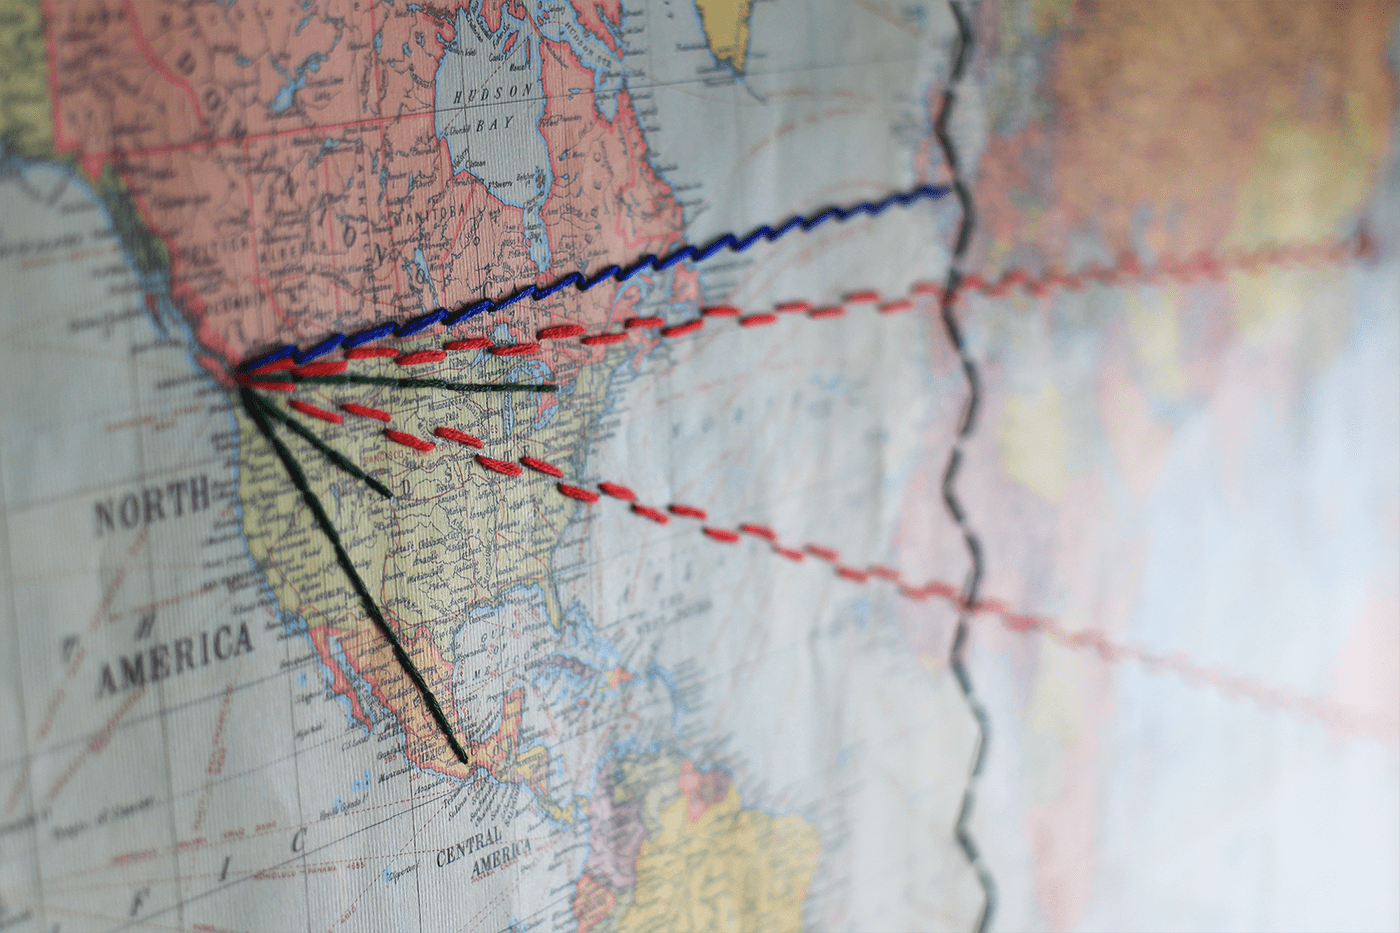
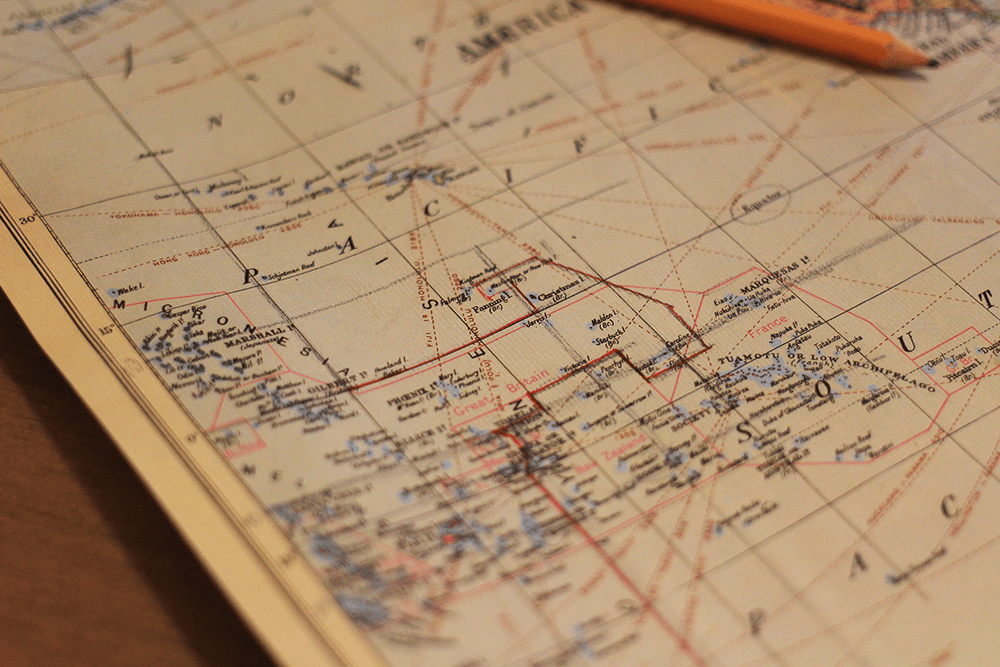
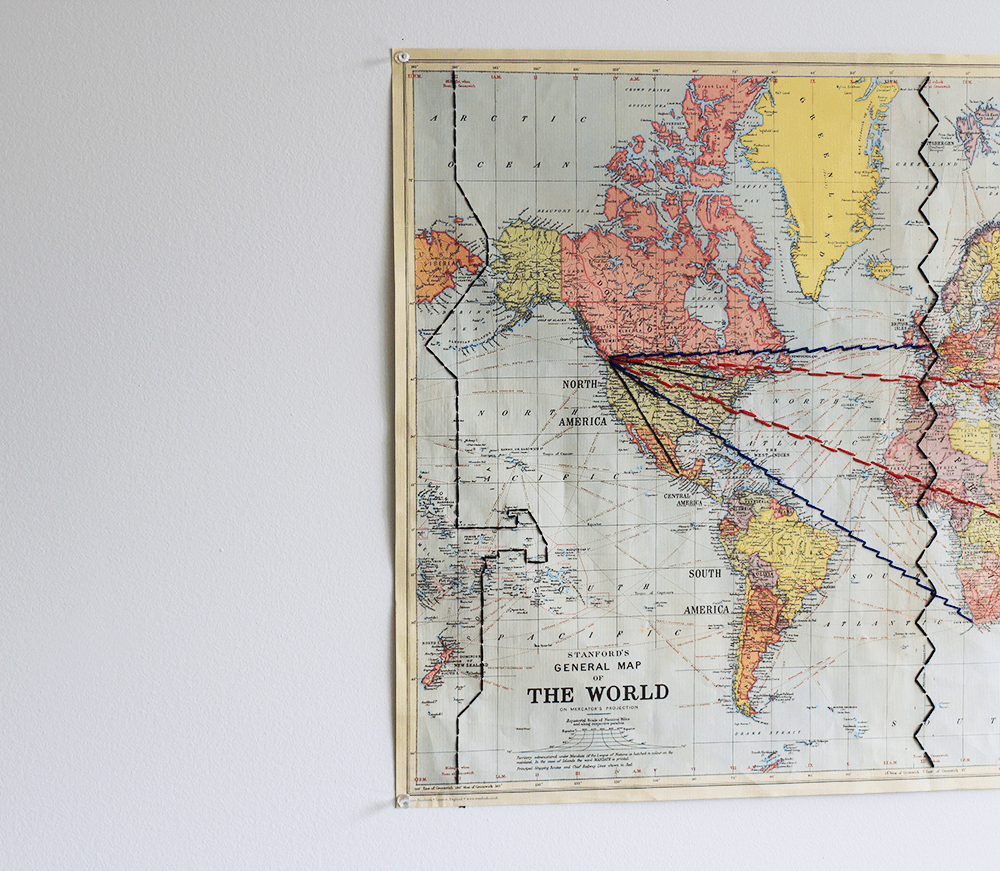
Stitching Tree’s Unseen Coworkers
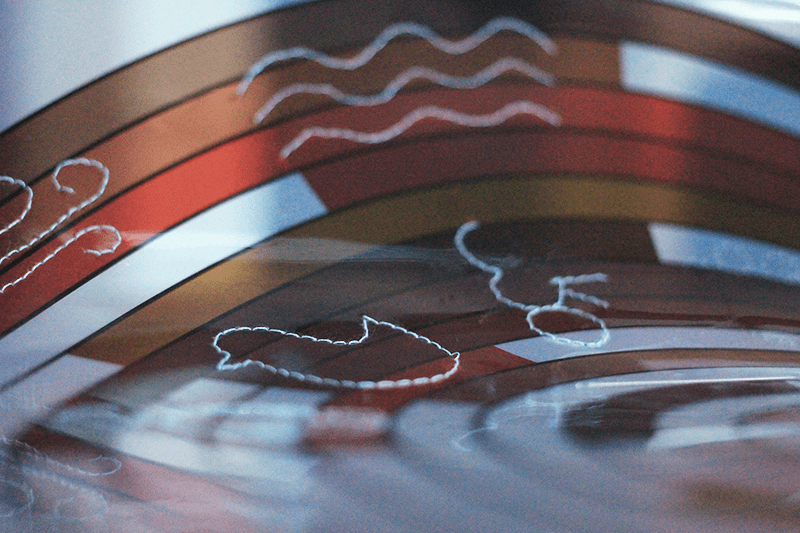
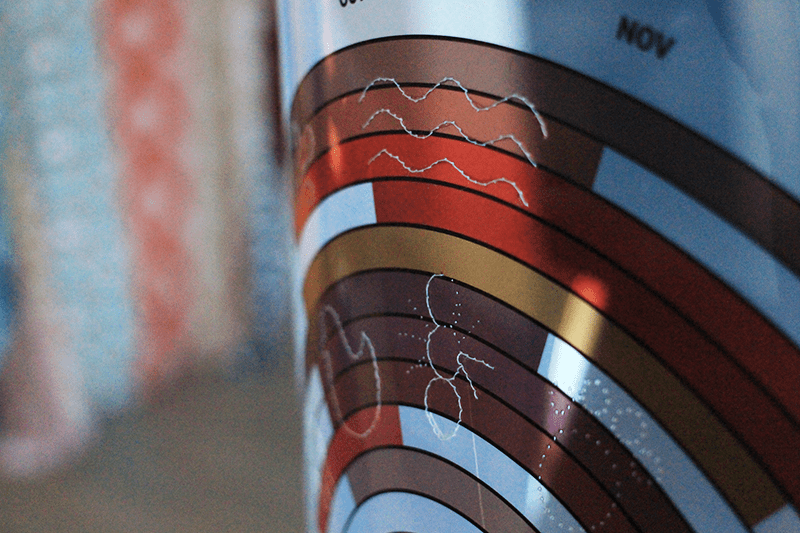
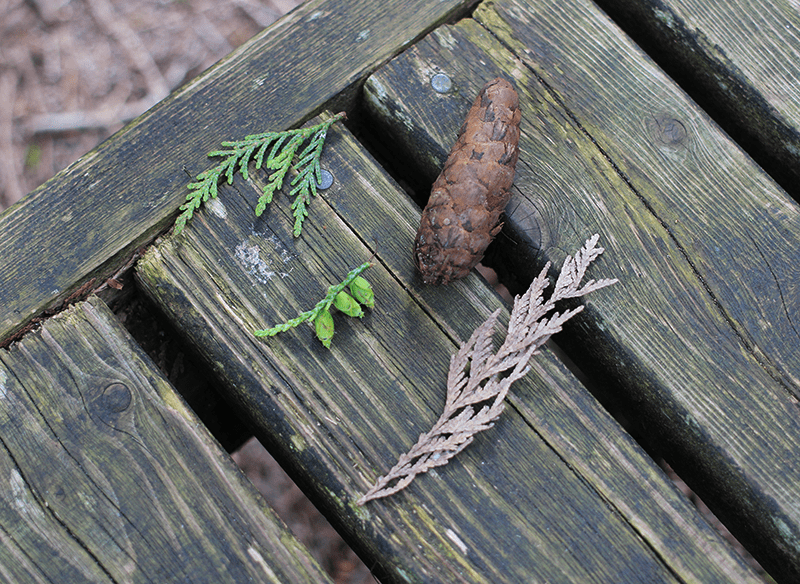
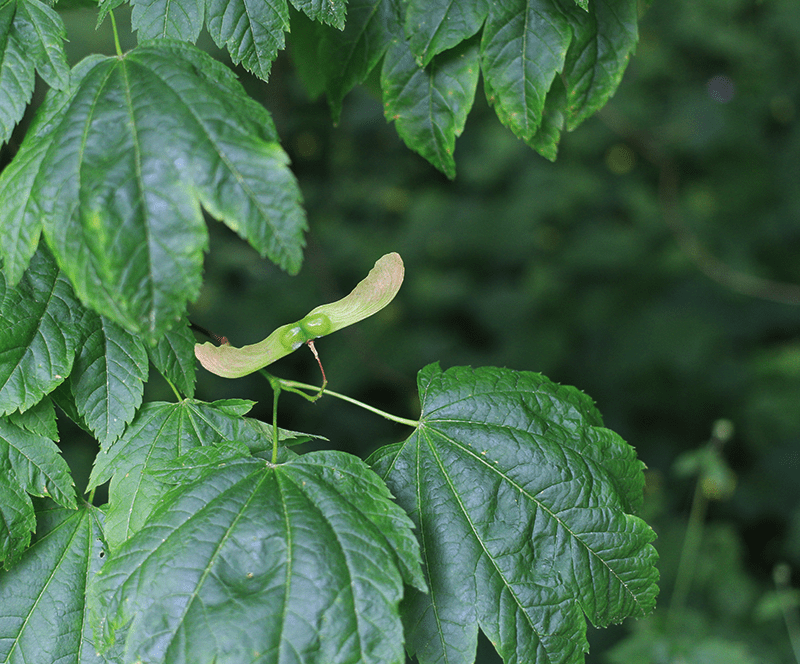
After designing the clock, I printed it on a transparent film to play with different visual elements to add on top or behind. I was exploring possibilities of adding actual leaves and seeds I gathered walking around, but what I learned from this research made me consider unrecognized seed dispersal alleys should be part of the outcome. Therefore, I decided to stitch the icons of wind, water, human, bird, insects and four-legged animals on it.
Reflection on attempting to build a past phenological clock
1. What do this knowledge, the clock, and the pursuit of it, change or offer us?
Reforming and reflecting the modern relationship with nature
More than half of modern humans now live in urban areas, and the number is expected to grow more and faster. It’s hard to imagine living independently and disconnected from any urban, industrialized infrastructures and products, such as the type of place we live, the food we eat, and the clothes we wear. In contrast, city dwellers are becoming more independent and disconnected from neighbours, citizens and non-human beings. Time is a great frame that everyone can relate to, one thing that every finite living being experiences biologically. Knowing and comparing this shared notion of time and our limited human time on Earth gives us a pair of glasses that we can see the world through ecological prescriptions.
I have been thinking about our current relationship with nature in the summer semester. In the past, our relationship with nature was more than leisure activities to get away from city living and extracting resources without the responsibility of the consequences. Once upon a time, nature was feared, worshiped and respected sacredly. Growing up in a developing country like Korea, where nature had to become meaningless resources without economic purposes quickly, I worry about a future where most of the world is urbanized, altered and interrupted by humans to exist simply. People move to cities for a job, education, and other opportunities they desire to pursue, and this circumstance makes it difficult to answer what sustainable living means. With the knowledge I gained from collecting phenology data from citizen science apps and research papers, I began to pay more attention to my day-to-day environment and be curious about what other beings surround me with. Researching different plant timings and life cycles, I also expose myself to learning about the food and medicine nature offers to sustain us. It also relates to understanding the relationship between invasive species and native ecosystems in danger and keystone species that will help prevent extinctions. Working on this project makes me wonder what and how the phenological clock and its communication design can reveal to the public, who might haven’t been able to expose themselves to the complexity of our relationship with nature due to numerous social, cultural, political, economic and other matrices that shape us.
2. What people and ideas must be brought together to attempt to build one? Do the way I pursue it and the questions I ask change the nature of the clock?
If we were to build one dense clock to show the past phenology, we would need biologists, botanists, historians, citizens, elders, and numerous stories from people’s lives. The way I’m pursuing the clock through interconnected relationships makes me question, “what will this clock and the information it holds do to the public?” Because of this question, I sometimes feel a little lost in imagining what visualization method best represents different relationships and stories between people and species.