Categories
Grad Design Studio Summer 2022

Interval disconnection from modernity and its quantified time

Buccaneer Bay Provincial Park

Backcountry Camping along the traditional territories of the Tla’amin, Klahoose, shíshálh, and Skwxwú7mesh nations (Sunshine Coast): three sunrises, three moonrises

This project was one of the most intriguing projects I planned to do this summer. I wanted to relocate from the urban environment and its quantified structure of time to cyclical time in nature to compare my relationship with time in opposite environments.

It includes similar methods from the previous Investigating my relationship with time project, but since I didn’t check the quantified clock time, my reflections happened irregularly.

1. Journaling: My three sun-ups time journal

Day 1-1. Sometime after I woke up, most likely morning

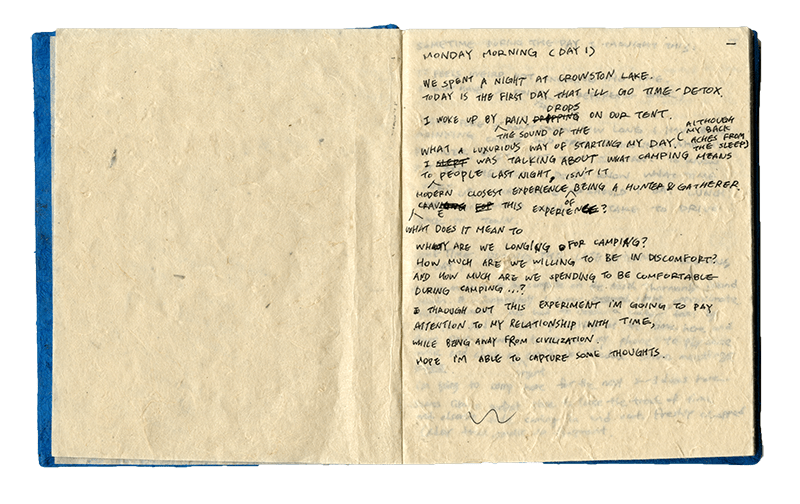
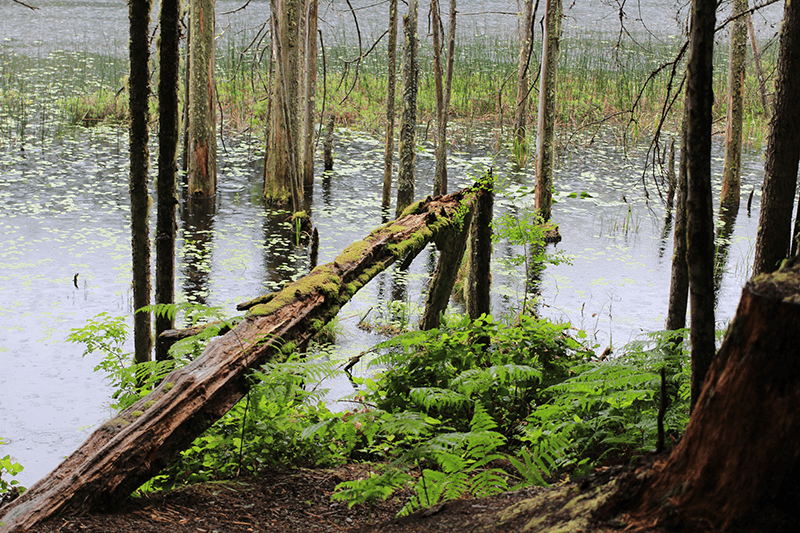
We spent a night at Crowston Lake. Today is the first day I’ll go on “the quantified time detox.” I woke up to the sound of the raindrops on our tent. What a luxurious way of starting my day, despite minor backaches. Last night before falling asleep, I was talking to my partner about how backcountry camping feels like the closest experience of being a hunter & gatherer in modern-day living, although the objects I rely on to survive are heavily artificial and industrialized. Why am I longing for camping? What does it mean to crave this experience? And how much are we willing to be in discomfort? How much are we willing to spend not to lose comfort and convenience during camping? Throughout this experiment, I’m going to pay attention to my relationship with time while being away from civilization. I hope I’m able to capture some thoughts.

Day 1-2. Sometime during the day

It feels weird not knowing the time. I don’t have a point in time to reference back. So It’s hard to tell how long I’ve been drinking coffee and giggling with my partner. It’s not that I want to know, or I have to know these things. But the fact that I don’t know what time I woke up, what time I should eat lunch, or how long it will take to drive back to town makes me realize how freeing it feels to not structure my mundane activities in the measured and numerical notion of time.

Day 1-3. Sometime during the late afternoon or evening

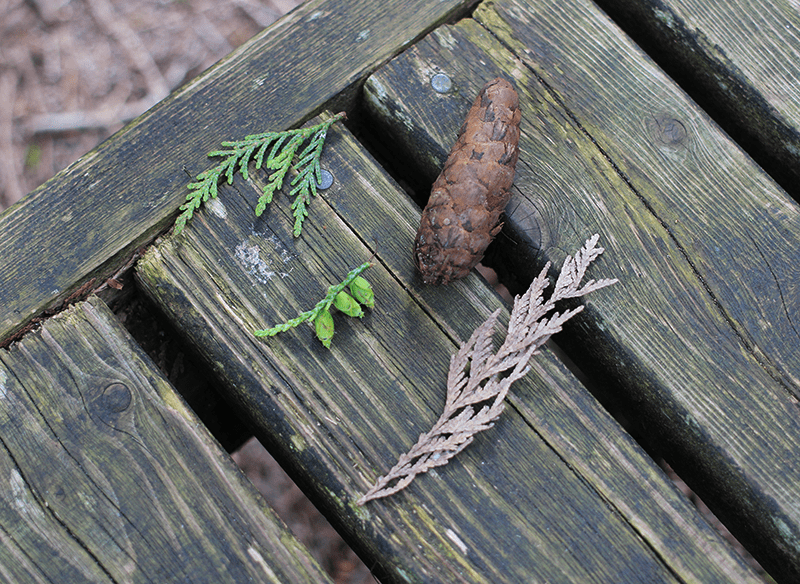
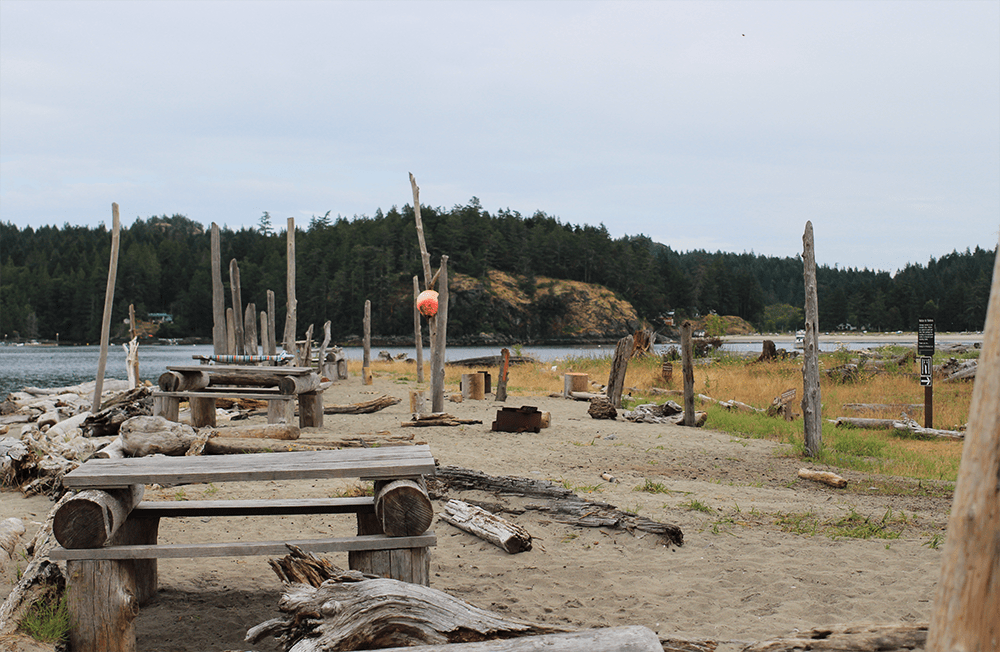
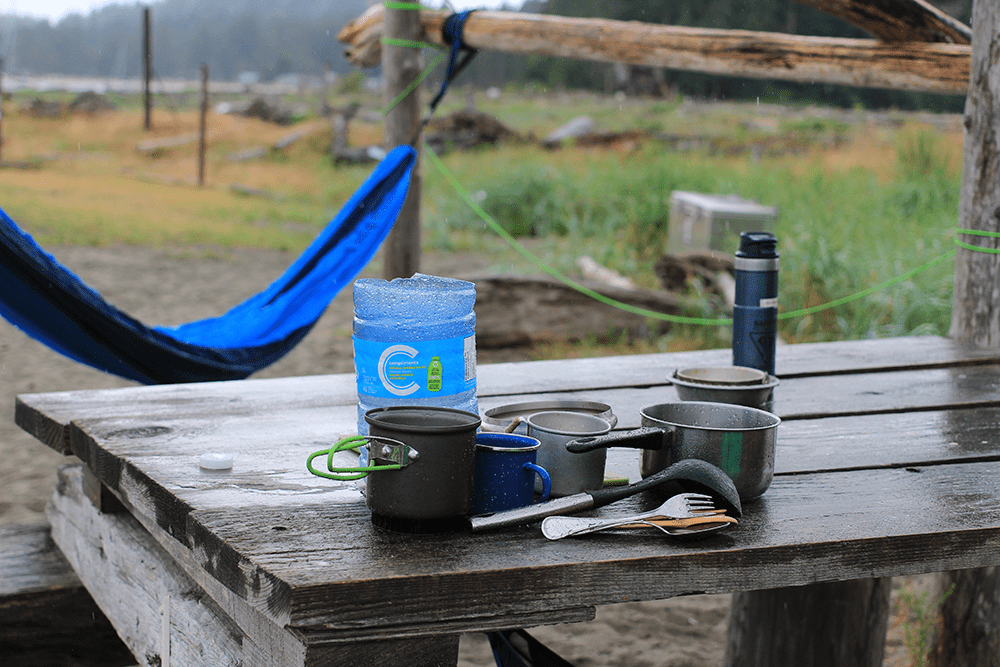
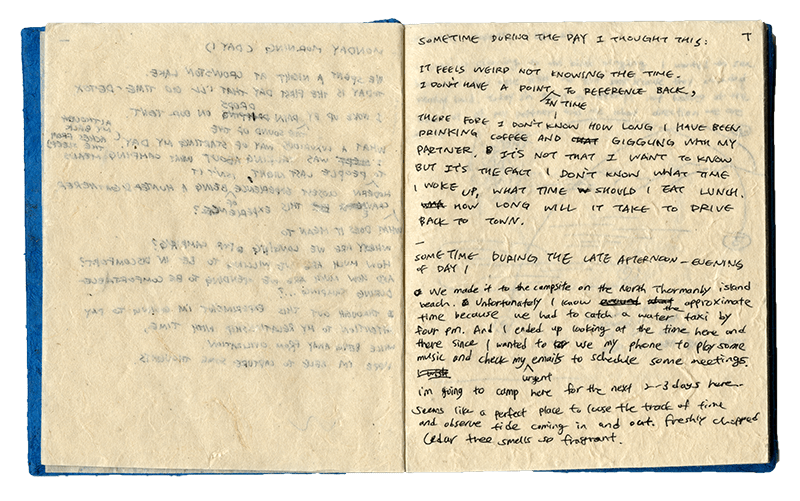
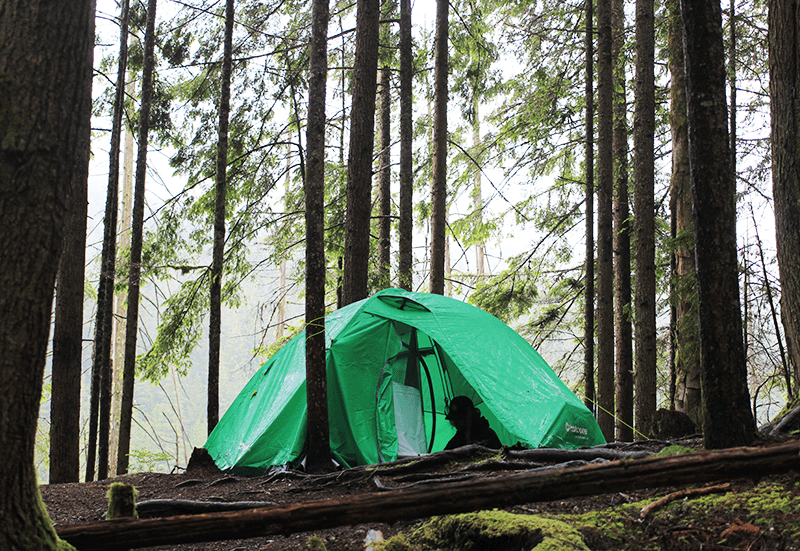
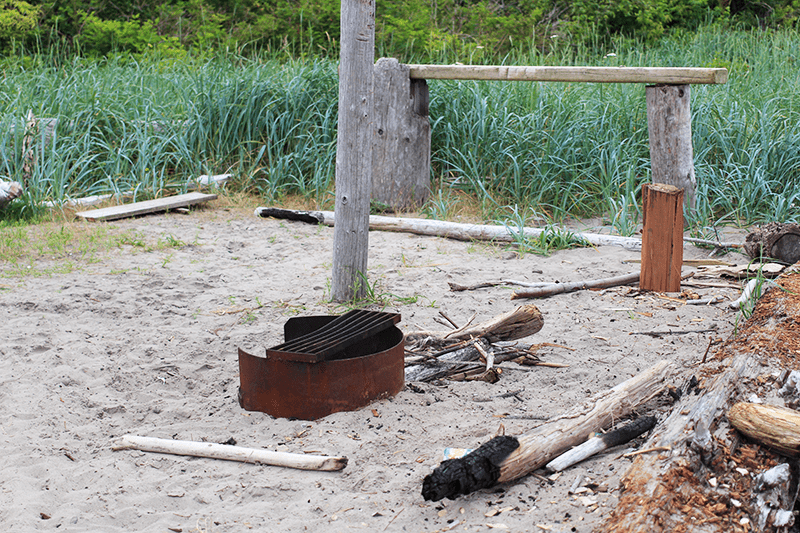
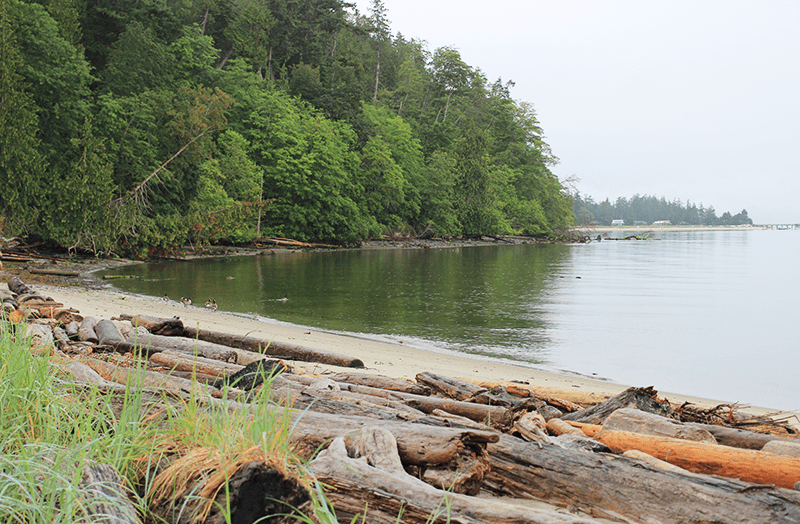
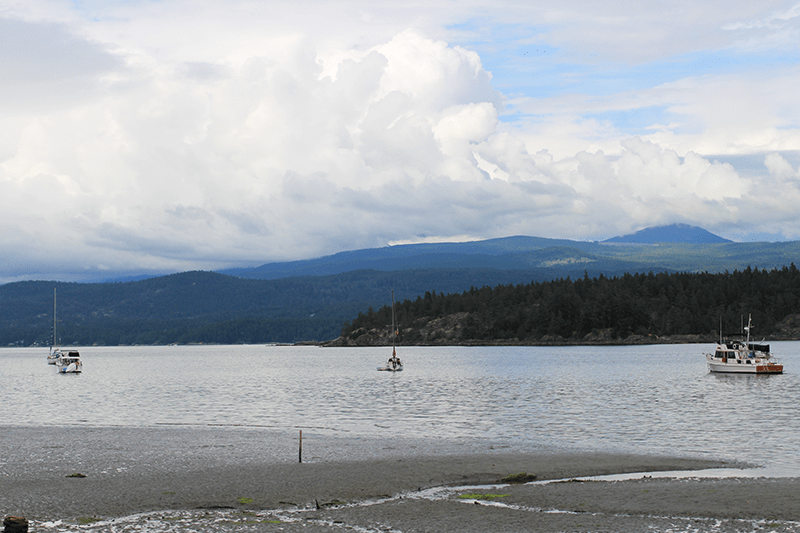
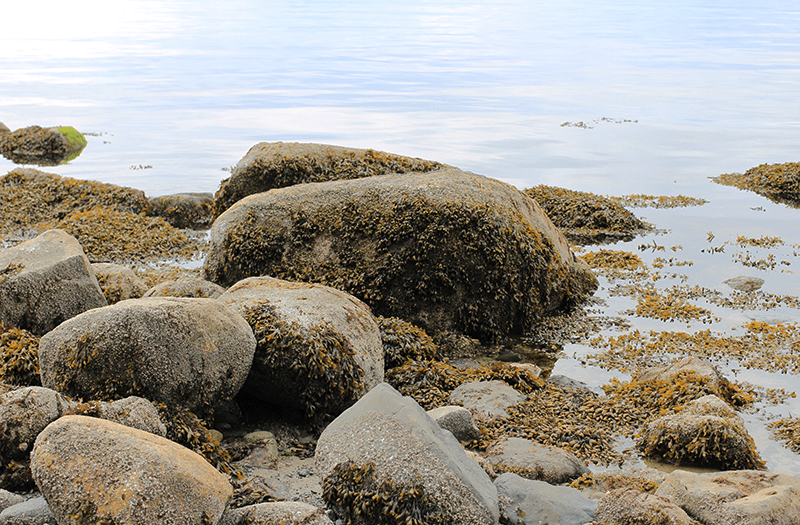
We made it to the campsite on the North Thormanby island beach campsite. Unfortunately, I know the approximate time because we had to catch a water taxi by 4 pm. (It sounds more like a water bus or train than a water taxi) And I accidentally looked at the quantified clock time from playing music on my phone and checking urgent emails to schedule meetings next week. We are going to camp here for the next two to three days. It seems like a perfect place to lose track of time and observe other things that could indicate time, such as this tide coming in and out right in front of the campsite. Freshly chopped cedar tree for fire smells so fragrant.

Day 2. Sometime in the morning

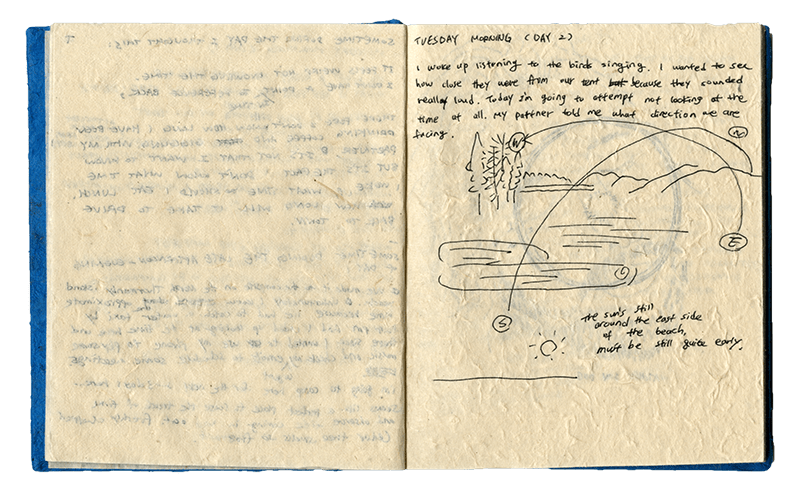
I woke up listening to the birds singing. I wanted to see how close they were to the tent because they sounded loud. Today I will attempt not to look at the time at all, probably my phone in general. My partner told me where north, south, east, and west are from the campsite. The sun is still around the east side of the beach in front of us, so it must be still quite early in the morning.

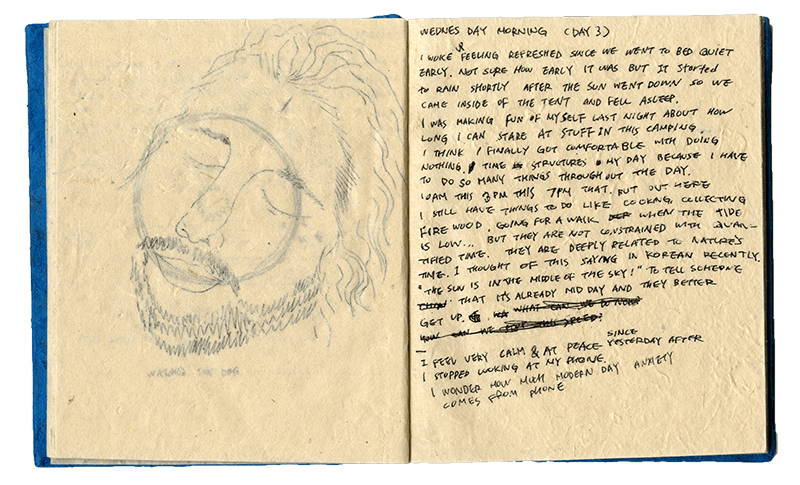
Day 3. Sometime in the morning

I woke up feeling refreshed since I went to bed quite early last night, although I don’t know how early it was. It started raining shortly after the sun went down. So we had to come inside the tent, and I must’ve fallen asleep quickly. Last night, I was laughing at myself about how long I could stare at the water, geese, clouds, and other beings surrounding me without getting bored during this camping. It might be because I feel comfortable doing nothing. In the urban environment, juggling work and study, clock time structures my day because I tell myself I need to get x amount of things done within a day, do this at 10 am, do that at 7 pm… I also need to coordinate my schedule with others frequently. But out here, things I need to do is cooking, collecting drifted wood for fires, and going for a walk before the tide comes back. They aren’t constrained by quantified time. Activities are connected to nature’s time, unlike the city time. I’ve been thinking about this idiom in Korean; “The sun is already in the middle of the sky.” This saying is usually used to tell someone that it’s already mid-day and they better wake up. This is how I guess time here on the island, looking at the sun’s location in the sky.

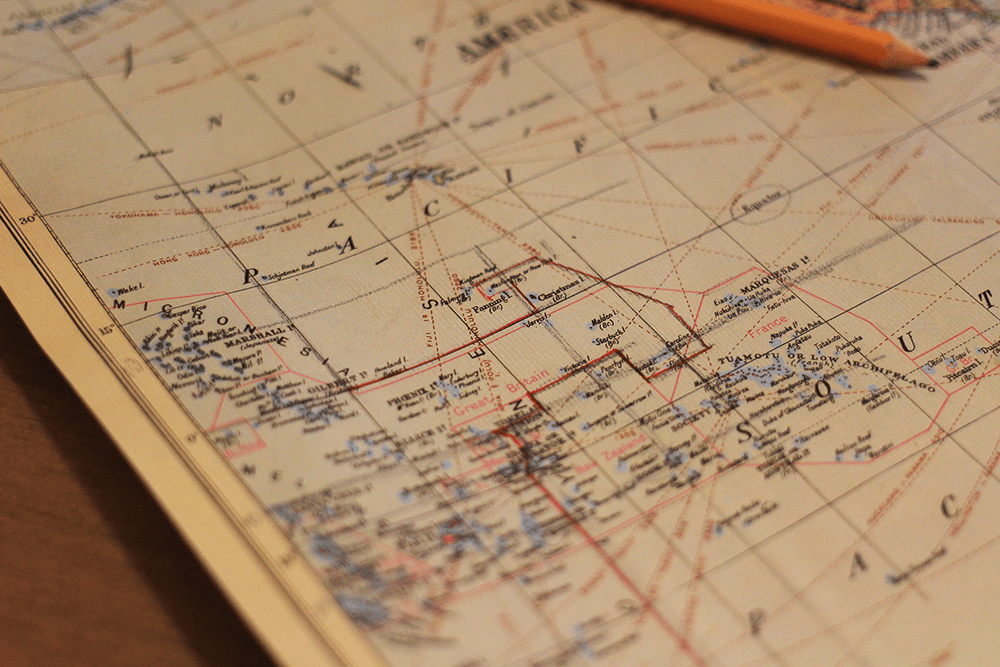
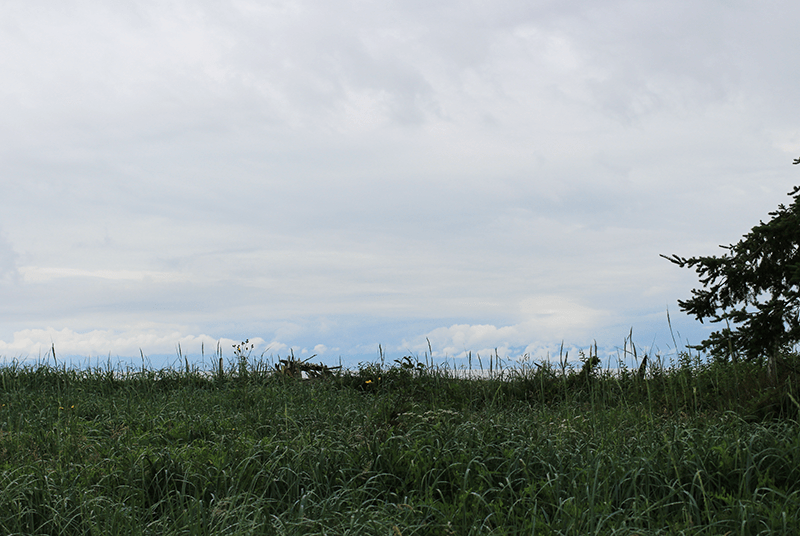
2. Tracking the sun path to tell time

After spending hours observing the sky, I remembered the cardinal points around the campsite would help me tell time depending on where the sun was located in the sky. Since I wasn’t entirely sure about the island’s geographic location, looking at the sun path also helped me understand the space I am in.

Visualizing North Thormanby Island sun path with traditional Korean patterns

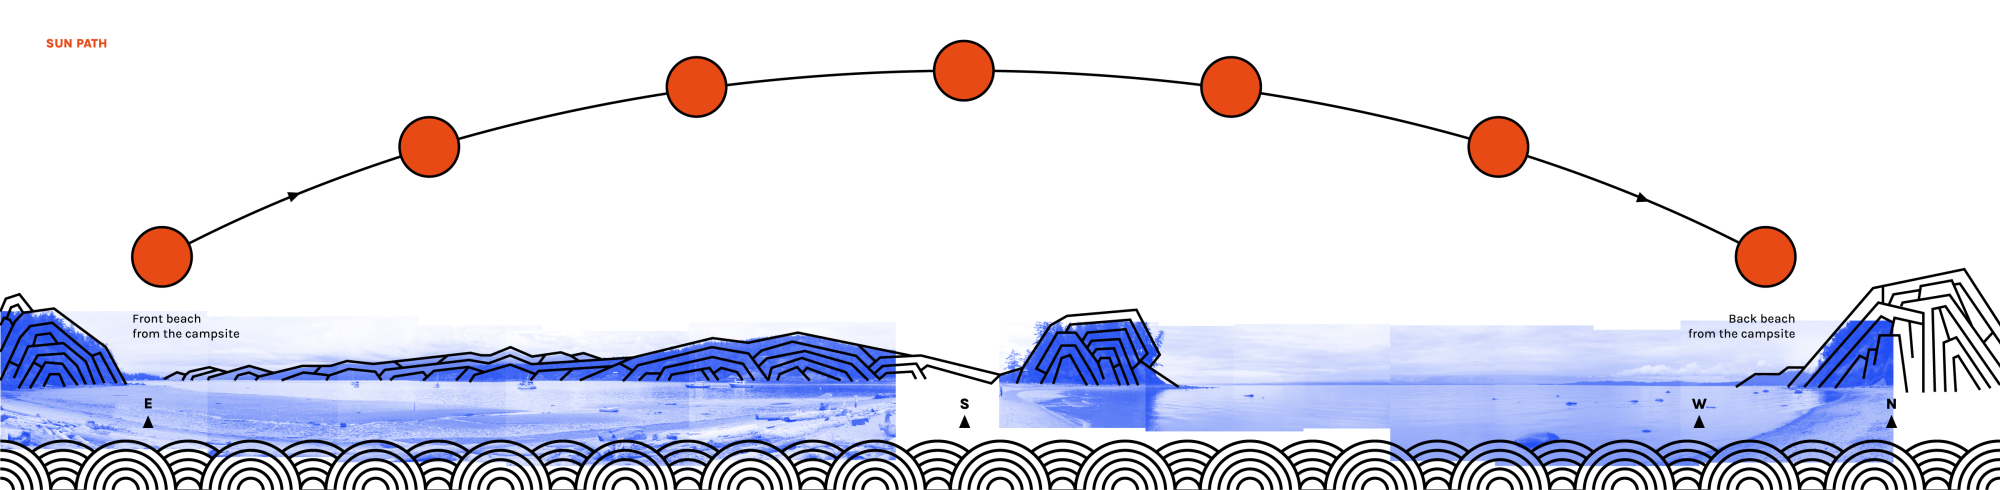
Dean Buonomano, in his book about the neuroscience and physics of time, talks about the early importance of astronomy to tell time prospectively, particularly the sun and the moon, as he describes “the two most prominent bodies in the sky.” To our ancestors, tracking time meant fundamentally calendric to predict the seasons and read patterns of potential prey for survival.

For most of my life, I lived in a city apartment surrounded by industrialized urban surroundings. Looking at the sky, guessing what time of the day it is feels foreign and almost silly when it was the primary way of keeping time across the culture.

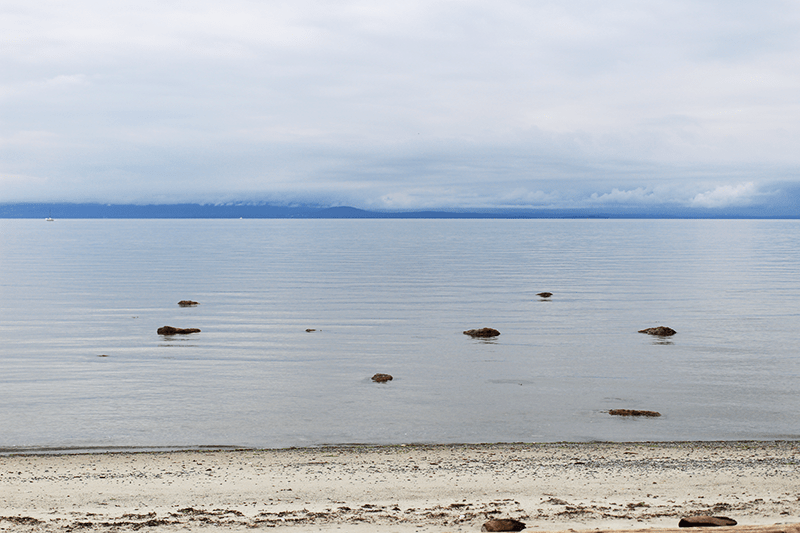
3. Reading deep time: retrospective time in geology

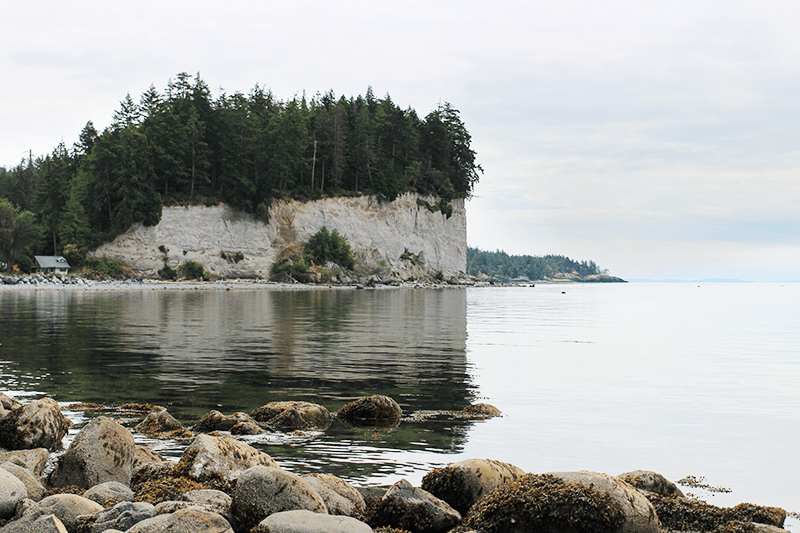
North Thormanby island is surrounded by big light colour cliffs. I had to grab a chance to walk around the island to look closer when the tide was low.

Shorelines around the island

My partner is a geologist, and sometimes I learn different time scales from his ability to read deep time in rocks and landscapes. Obtaining a glimpse of geological knowledge makes me look at the world through a different lens, even though it’s temporary. And this experience teaches me that I encounter things that hold an enormous time scale every day. How long would it have taken for pebbles to form around the construction site next to the campus?

When I got closer to the cliffs, I saw they are made of fine particles. And with my partner’s support, I came to understand these fine particle deposition cliffs around the island (also generally around the Vancouver area) tell so many stories of the past.

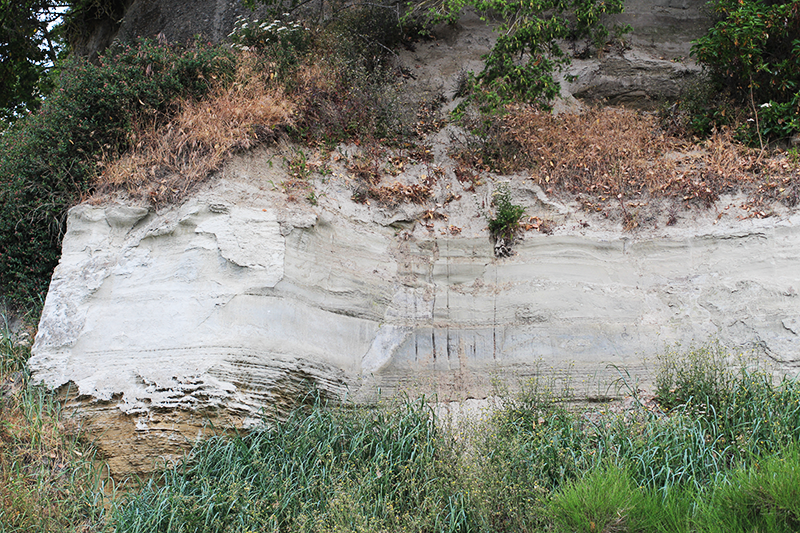
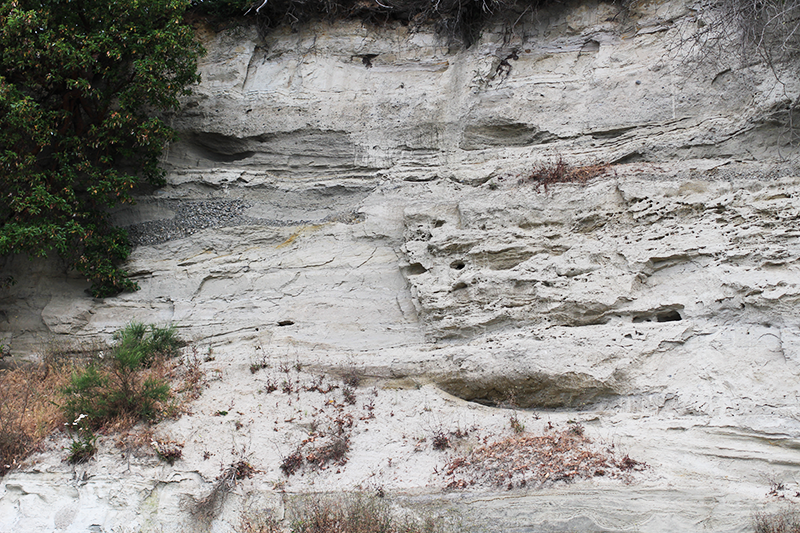
These fine sediments from the cliffs show that it wasn’t a high enough energy environment to cause turbulence when accumulating. And only a fairly flat water environment like a lake lets fine sediments come out of the water, for instance, mud and silt. And the sediment settles down to the bottom of the lake and stacks up on itself. However, we see these cliffs right by the ocean today, and for this area to be a lake, water levels would have been about 100 meters lower than they are currently. So the cliffs show the accumulation would have been caused during the last ice age when the glaciers were around, which helps us speculate they are between 10 to 14,000 years old sediments.

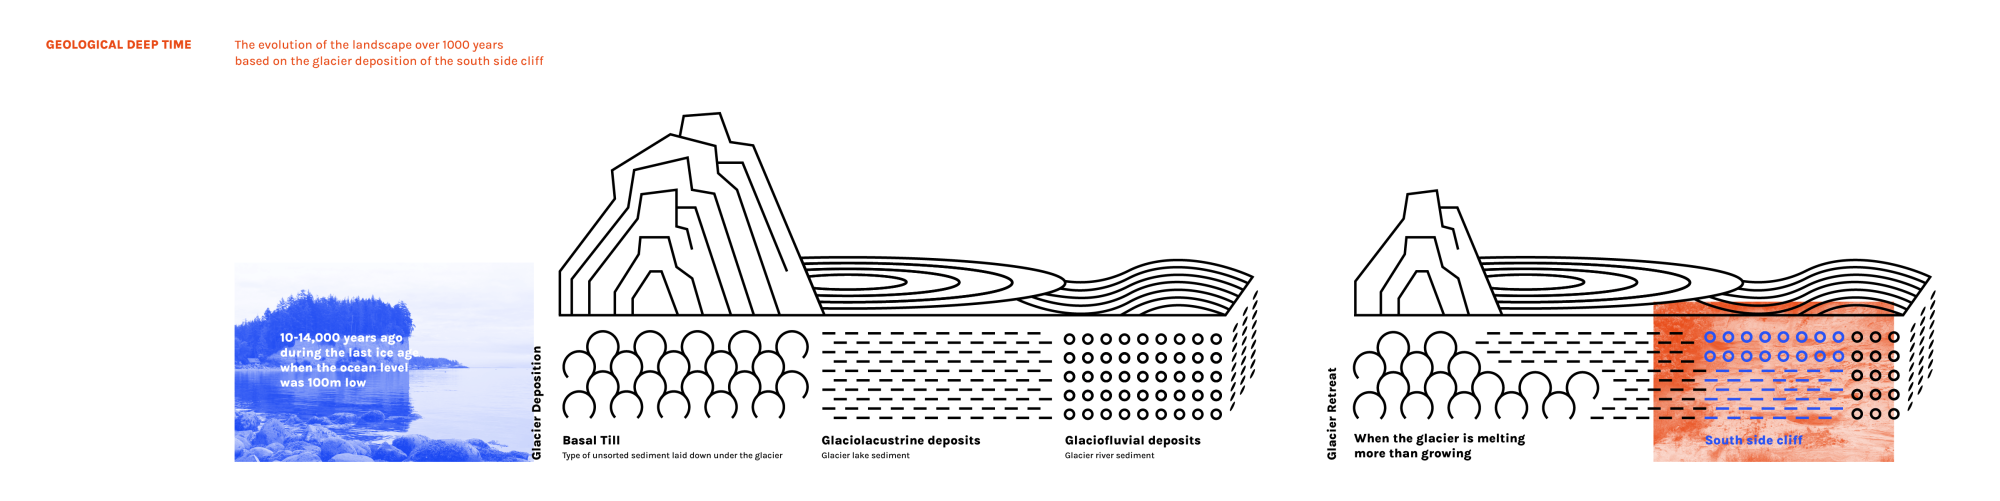
So the particular deposit that the cliffs are made of is called glaciolacustrine (glacier lake) and glaciofluvial (glacier river) sediments. And depending on which sediment is on top, you can speculate the glacier movements, whether it was retreating or advancing. For example, as the front part of a glacier melts, it forms a lake which creates glaciolacustrine sediments. And the lake eventually drains into a river, creating glaciofluvial sediments. So if you imagine a landscape with a glacier, lake and river like the picture above, as the glacier pulls back, lake sediments at the front of the glacier will be covered by river sediments because the entire system retreats. And this deposition of river sediments on top of lake sediments was what my partner was able to observe.

Also, when the glaciers come through, the weight of the ice squishes the rocks underneath it. Huge massive ice acts like a big bulldozer and will scrape and crush rocks while pressing and squeezing them with their weight. And we can see the layers on the cliffs to this date since they were preserved after deposition instead of getting destroyed by later glaciations.

4. Conclusion

Through a few days of backcountry camping without using quantified clock time, I got to experience different perceptions of time that was always around me but had never been paid attention to. The disconnection from civilization helped me stay in tune with the natural surroundings and allowed me to see different time frames beyond human lifetimes. I find something attractive about creating visual translation to capture imperceivable knowledge of time.

Categories
Grad Design Studio Summer 2022

What does it mean to generate Phenological Clocks?

Seed dispersal timing and agents of 15 native trees in BC

I was first introduced to Natalie Jeremijenko’s Phenological clock work by my supervisor last year. Natalie is an environmental artist and engineer. She, Jake Richardson and Blacki Migliozzi created a beautiful data visualization tool that displays local flora and fauna timings on a Jan through December clock face. These seasonal events captured on the clock show connections and dependencies of flowers, insects, butterflies, bees, birds and trees in the perpetuating annual cycle from the innermost to the outermost rings. My supervisor and I wanted to bring this beautiful work back to life at Emily Carr so that everyone can collectively record numerous ecosystems that invisibly surround us.

While discussing the logistics and challenges of the work, I wanted to make an analogue example of the phenological clock to understand the design and the process of rebuilding this platform. I began to desk-research seed dispersal timings for 15 different native trees.

Data visualization and infographic

Attempting to create a native tree’s seed dispersal clock based on other researchers’ work, I wanted to understand what it means to put this work out in the world again, imagine what it can do, and how I’d visualize and communicate this data example.

Since I decided to continue my study after industry experience, I couldn’t stop thinking about the possibility of my role outside the commercial realm. Graphic design is one of the most influential and strongest communication tools to disseminate information and diverse messages. After practicing this daily at work, I almost automatically use relevant skills to make the information digestible and “aesthetic.” However, thinking about the role of graphic design in sustainable everyday living, environmental conservation, and consumerism, I sometimes couldn’t help but feel skeptical and inadequate about my skills and strengths. Especially interacting with people making practical, social, and direct changes in people’s relationships with nature made me question whether the urgent work we collectively need to do as humans even needs graphic designers. A series of questions and doubts arising from reflecting on my practice and others’ help me ponder other ways I could expand my work. Could displaying, showcasing, and materializing significant but invisible time through ecological perspectives support and empower individuals’ daily decision-making with sustainability in mind?

Collecting data

While researching information to collect seed dispersal timings for the clock, I was slowly able to grasp some trees’ common reproductive features and seasonal cycles that I was unaware of. I also realized how each seed forms differently to be carried away by humans and non-humans and how accessible and open the related knowledge is through government and citizen-led science websites.

Collecting the seed colours from google images

While desk-researching reproduction features and timings of 15 native trees in BC, I could recognize some of the seeds from the pictures. I was living in a house with a patio last fall. After rainy, windy days, little seeds often covered house entrances and the shoe rack. (I think they were Paper Birch tree seeds) I was curious about what they were but never knew that they were tree seeds carried by wind, rain and sometimes my housemates. After gaining this little amount of knowledge, I noticed I look at the ground more when I walk, trying to find seeds that I might recognize and see whether I can find the mothers that produced the seeds. I found myself interacting with city trees more consciously just because now I know some of their names, leaves, and seeds.

How can I visualize and communicate this experience with trees beyond the data? What do I want the audience to experience while looking at this information?

Stitching Tree’s Unseen Coworkers

After designing the clock, I printed it on a transparent film to play with different visual elements to add on top or behind. I was exploring possibilities of adding actual leaves and seeds I gathered walking around, but what I learned from this research made me consider unrecognized seed dispersal alleys should be part of the outcome. Therefore, I decided to stitch the icons of wind, water, human, bird, insects and four-legged animals on it.

Reflection on attempting to build a past phenological clock

1. What do this knowledge, the clock, and the pursuit of it, change or offer us? 

Reforming and reflecting the modern relationship with nature

More than half of modern humans now live in urban areas, and the number is expected to grow more and faster. It’s hard to imagine living independently and disconnected from any urban, industrialized infrastructures and products, such as the type of place we live, the food we eat, and the clothes we wear. In contrast, city dwellers are becoming more independent and disconnected from neighbours, citizens and non-human beings. Time is a great frame that everyone can relate to, one thing that every finite living being experiences biologically. Knowing and comparing this shared notion of time and our limited human time on Earth gives us a pair of glasses that we can see the world through ecological prescriptions.

I have been thinking about our current relationship with nature in the summer semester. In the past, our relationship with nature was more than leisure activities to get away from city living and extracting resources without the responsibility of the consequences. Once upon a time, nature was feared, worshiped and respected sacredly. Growing up in a developing country like Korea, where nature had to become meaningless resources without economic purposes quickly, I worry about a future where most of the world is urbanized, altered and interrupted by humans to exist simply. People move to cities for a job, education, and other opportunities they desire to pursue, and this circumstance makes it difficult to answer what sustainable living means. With the knowledge I gained from collecting phenology data from citizen science apps and research papers, I began to pay more attention to my day-to-day environment and be curious about what other beings surround me with. Researching different plant timings and life cycles, I also expose myself to learning about the food and medicine nature offers to sustain us. It also relates to understanding the relationship between invasive species and native ecosystems in danger and keystone species that will help prevent extinctions. Working on this project makes me wonder what and how the phenological clock and its communication design can reveal to the public, who might haven’t been able to expose themselves to the complexity of our relationship with nature due to numerous social, cultural, political, economic and other matrices that shape us.

2. What people and ideas must be brought together to attempt to build one? Do the way I pursue it and the questions I ask change the nature of the clock?

If we were to build one dense clock to show the past phenology, we would need biologists, botanists, historians, citizens, elders, and numerous stories from people’s lives. The way I’m pursuing the clock through interconnected relationships makes me question, “what will this clock and the information it holds do to the public?” Because of this question, I sometimes feel a little lost in imagining what visualization method best represents different relationships and stories between people and species.

Categories
Grad Design Studio Summer 2022

Investigating Greenwich Mean Time

I struggle with finding the time to talk to my friends and family in Korea due to the time difference. I didn’t think much about how strange it is to have 16-17 hours difference between Korea and Vancouver when it only took 10 hours on a direct flight to get here. I don’t love being on my phone either, so sometimes it makes me feel like I’m not doing enough to maintain the relationships. But the real problem is the tiniest window of time I have that I can reach out to my friends and family; I have to be at home, not busy working, and it has to be the same for my friends and family. Besides, my friends are all over the world. (Mainly in Korea, but also in Australia, the UK, Germany, Mexico, Belgium, Berlin and even South Africa) There was an uncomfortable feeling rising about all these mathematic time differences. There was something about GMT that I needed to investigate myself.

The history of GMT

“In the second half of the nineteenth century, the world was rapidly becoming more interconnected. Markets for goods, capital, and labor; migration, imperialism, and colonialism; and internationalist movements reaching beyond the nation-state were different dimensions of globalization. A new infrastructure of railways, steamships, and telegraphs underpinned these cross-border movements.” Whose Time Is It? The Pluralization of Time and the Global Condition, 1870s—1940s (Ogle, 2013, p. 1380)

“Many people wished also to achieve a national time (in practice as well as in law), and even a world time. After the time-zone recommendations made by the Canadian engineer Sir Sandford Fleming were accepted by the Prime Meridian Conference of 1884 (along with Greenwich as the zero meridian), railway companies around the world began to move in the direction of coordinating their timetables with the new time zones in mind.” Clock Synchrony, Time Distribution and Electrical Timekeeping in Britain 1880-1925 (Gay, 2003, p. 126)

Why Britain is the Center of the World (YouTube video by an American filmmaker, journalist and YouTuber Johnny Harris)

According to the brief research around GMT, there was a need rising to synchronize, standardize and unify time globally by the late 1800s, in order to communicate information around railways and telegraphs.

Chester Arthur, US president at that time, held the International Meridian Conference in Washington with 41 nations who were in diplomatic relations with America “for the purpose of fixing upon a meridian proper to be employed as a common zero of longitude and standard of time-reckoning throughout the globe,” (International Conference Held at Washington for the Purpose of Fixing a Prime Meridian and a Universal Day, 1884)

After 20 days of discussing and voting on where should be the centre of the meridian passing, the Loyal Observatory in London, located in a little outskirts town called Greenwich, became the initial meridian for longitude and a way to measure and calculate clock time in a unified form. Just like this, the country with the most powerful navy force and exploration knowledge officially became the centre of the world.

It is almost impossible to imagine how else to think and experience time outside the globally unified time structure decided in Washington D.C. 137 years ago. This meridian line is the artificial result of imperial, colonial, political and economic activities by powerful nations. It still governs the timezone, the longitude and the map, and the perspective of the entire world. To visualize this unknown story of GMT, I started cross-stitching a zig-zag line along the meridian line.

Visualizing time differences

Once I finished stitching the zig-zag line, I began materializing the time difference information between me, my friends and my family.

For the ones that have more than 12 hours difference between Vancouver, such as Korea and Australia, I stitched alternate straight lines with red thread.

I stitched stretched zig-zag lines with blue thread for my friends in Europe and South Africa, which have an average of 8-9 hours difference. The least complicated straight green lines show the range of places which have a 1-3 hours time difference from Vancouver.

After slowly processing and visualizing the time difference data, the idea of GMT became more explicit in my head. Cold, logical, intellectual way of seeing the world and its time got exposed through the stitched lines on the map.

International dateline

The International Date Line, Explained (YouTube video by an American filmmaker, journalist and YouTuber Johnny Harris)

International dateline has another unexpected story plot in the time synchronization history. This 180° line that determines whether each nation will be 12 hours ahead of GMT or 12 hours behind has been changing over the years based on colonization and trading relations.

For example, if you look at the islands between the top of the international dateline, they are geographically not that far from each other. But because some of them belong to Russia, they will be in the Russian timezone which is 12 hours ahead of the British timezone. But islands that are in American territory will be aligned with the American timezone, which is 12 hours behind Greenwich loyal observatory.

The international line gets more complicated with numerous pacific islands around New Zealand and Australia; Over the years, each nation developed a different economic dependency and relations with other regional countries. So this artificial international dateline has been changing little by little and sometimes the line is shown differently depending on which map you look at.

Ever since I started thinking about what design can do at Emily Carr, this quote I read somewhere when learning about early feminism movements got stuck in my head; The personal is political. My personal struggles and curiosity about “why is it so difficult to find a window of time to talk to my friends and family?” led me to this tangled, unknown, but important historical shapes of our relationship with time.

How are we shaping our personal decisions in our lives every day? Are they based on your personal preference and values as an individual? If not, why? What are the root cause and invisible forces driving this world’s unsustainability? If I all agree to slow down, what conversations have to start happening?